# Collecting and mapping Census data using API: State data and maps
# Install required packages if not already installed
# install.packages(c("tidyverse", "ggmap", "mapproj", "tidycensus", "tigris", "tmap", "mapview"))
lapply(c("tidyverse", "ggmap", "mapproj", "tidycensus", "tigris", "tmap", "mapview"), require, character.only = TRUE)

# Set up tidycensus options to cache data
library(tidycensus)
options(tigris_use_cache = TRUE)

# Fetching Texas census income data by tract
tx_income <- get_acs(
  geography = "tract",
  variables = "B19013_001",
  state = "TX",
  year = 2020,
  geometry = TRUE
)

# Display the income data for Texas
tx_incomeLab04 Collecting and Mapping Census Data Using API: State Data and Maps
Note: This lab involves working with spatial data, which can be large and resource-intensive. I have set the code chunks that generate interactive maps to eval = FALSE for this webpage. The images below are screenshots of the expected outputs when the code is run locally. If you’re interested, feel free to copy the code and run it in your local R environment, such as RStudio, for the full interactive experience.
1 Texas Income Data Map
# Plotting the income data map for Texas
plot(tx_income["estimate"])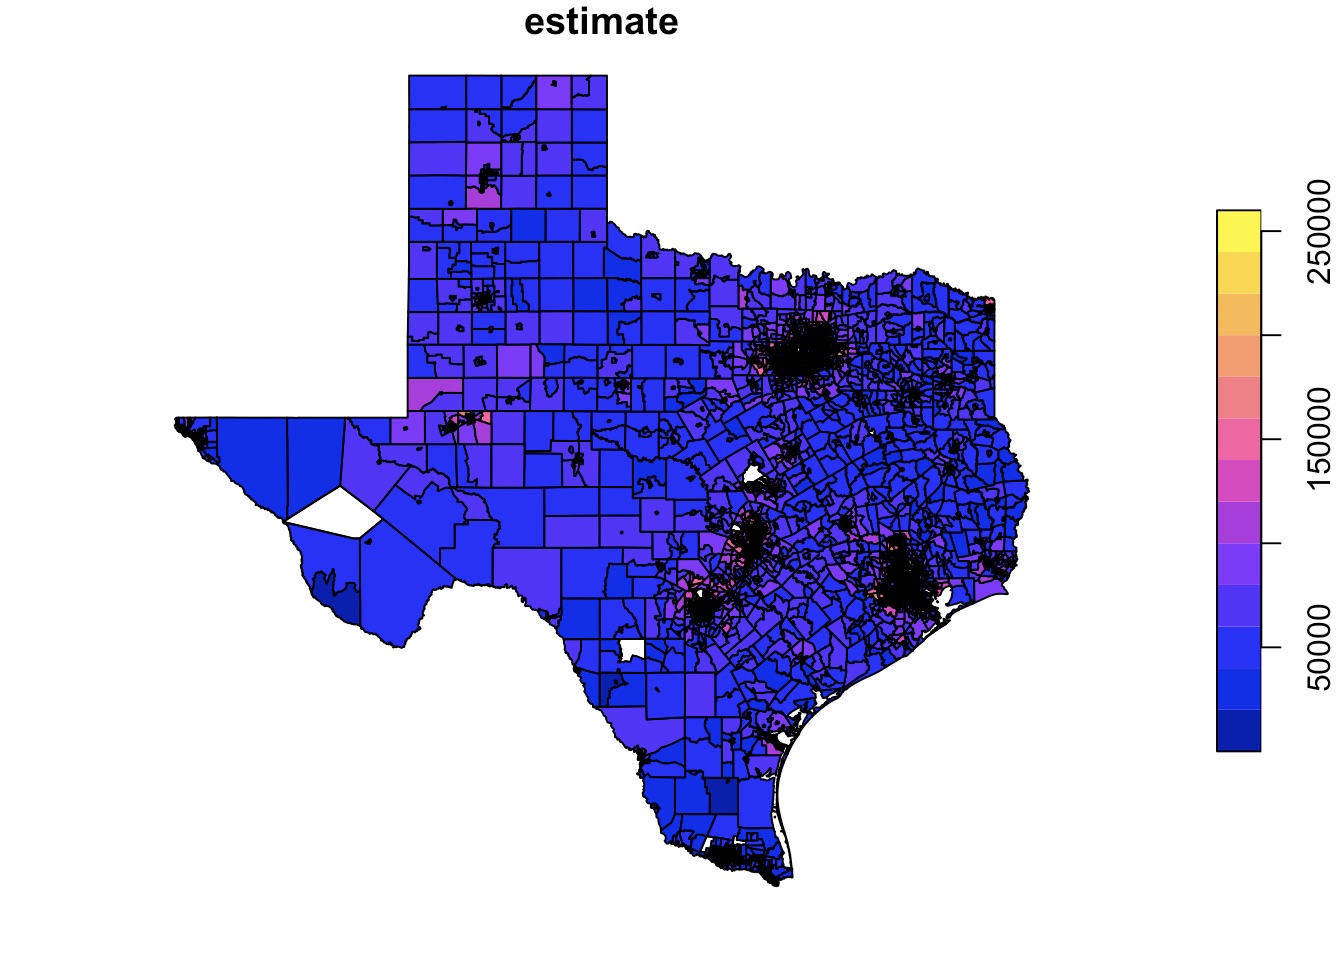
2 Dallas Income Data Map
library(tmap)
tmap_mode("view")

# Fetching Dallas county income data by tract
dallas_income <- get_acs(
  geography = "tract",
  variables = "B19013_001",
  year = 2020,
  state = "TX",
  county = "Dallas",
  geometry = TRUE
)

# Plotting Dallas income data using tmap
tm_shape(dallas_income) +
  tm_fill(col = "estimate", palette = "YlOrRd", alpha = 0.5)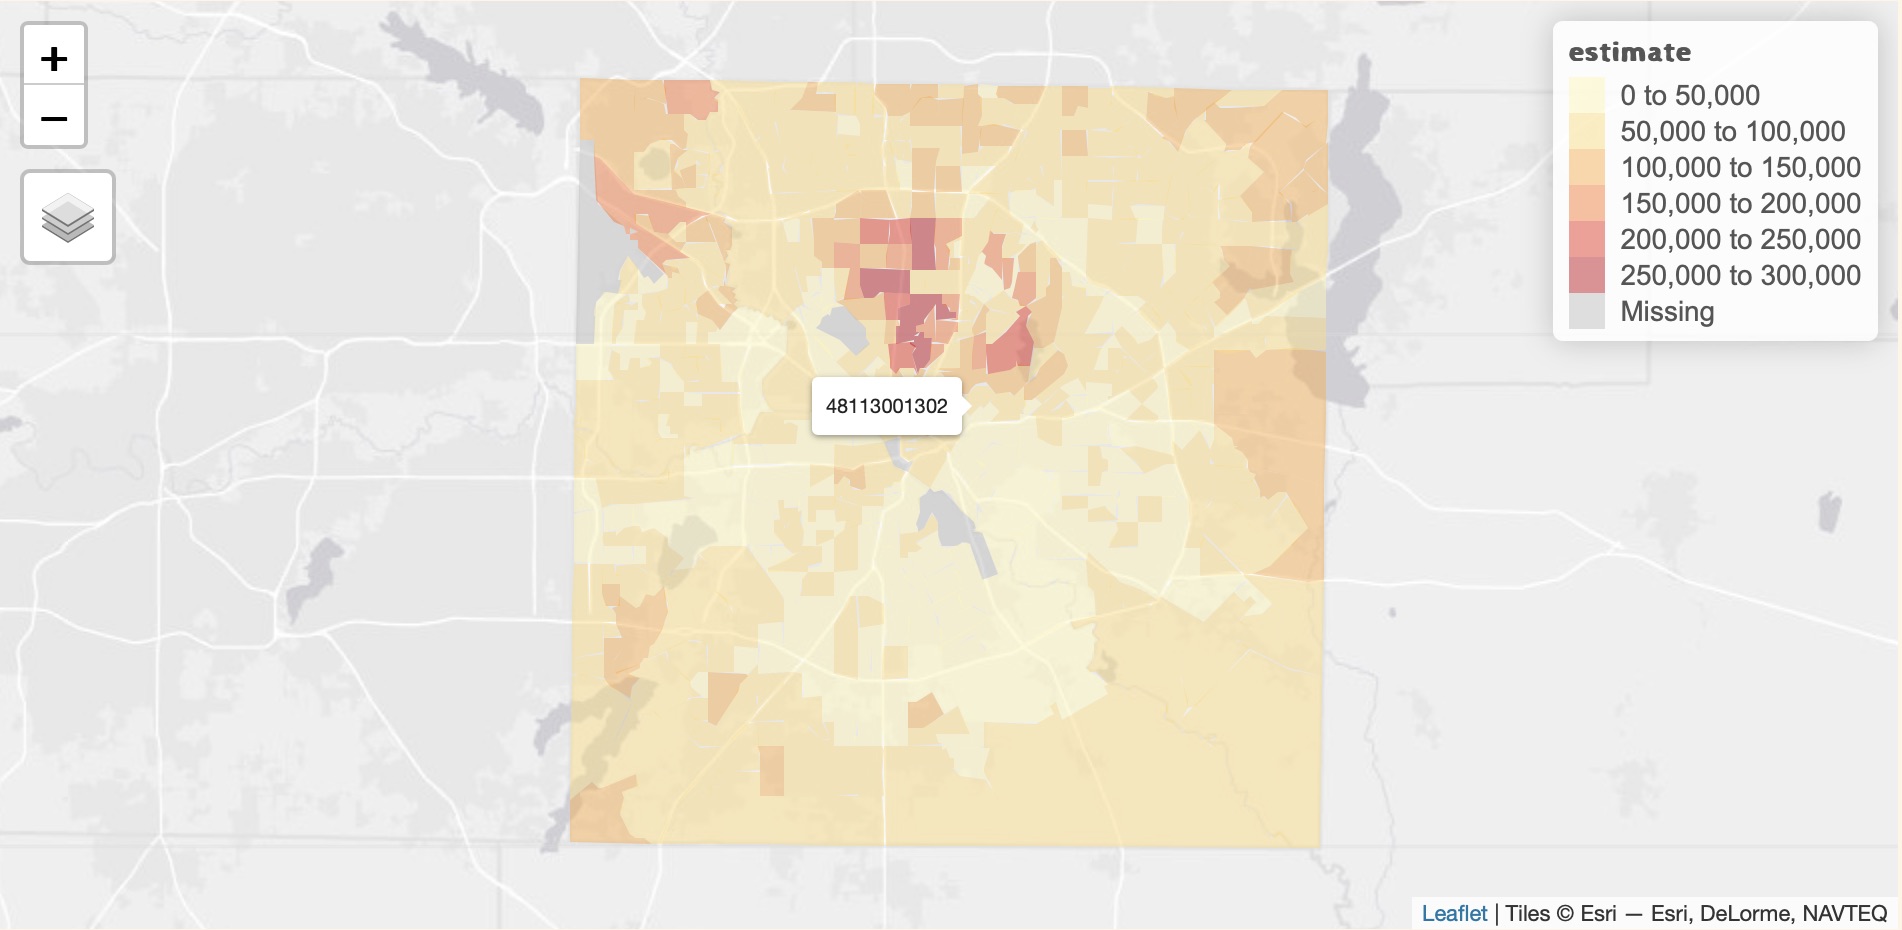
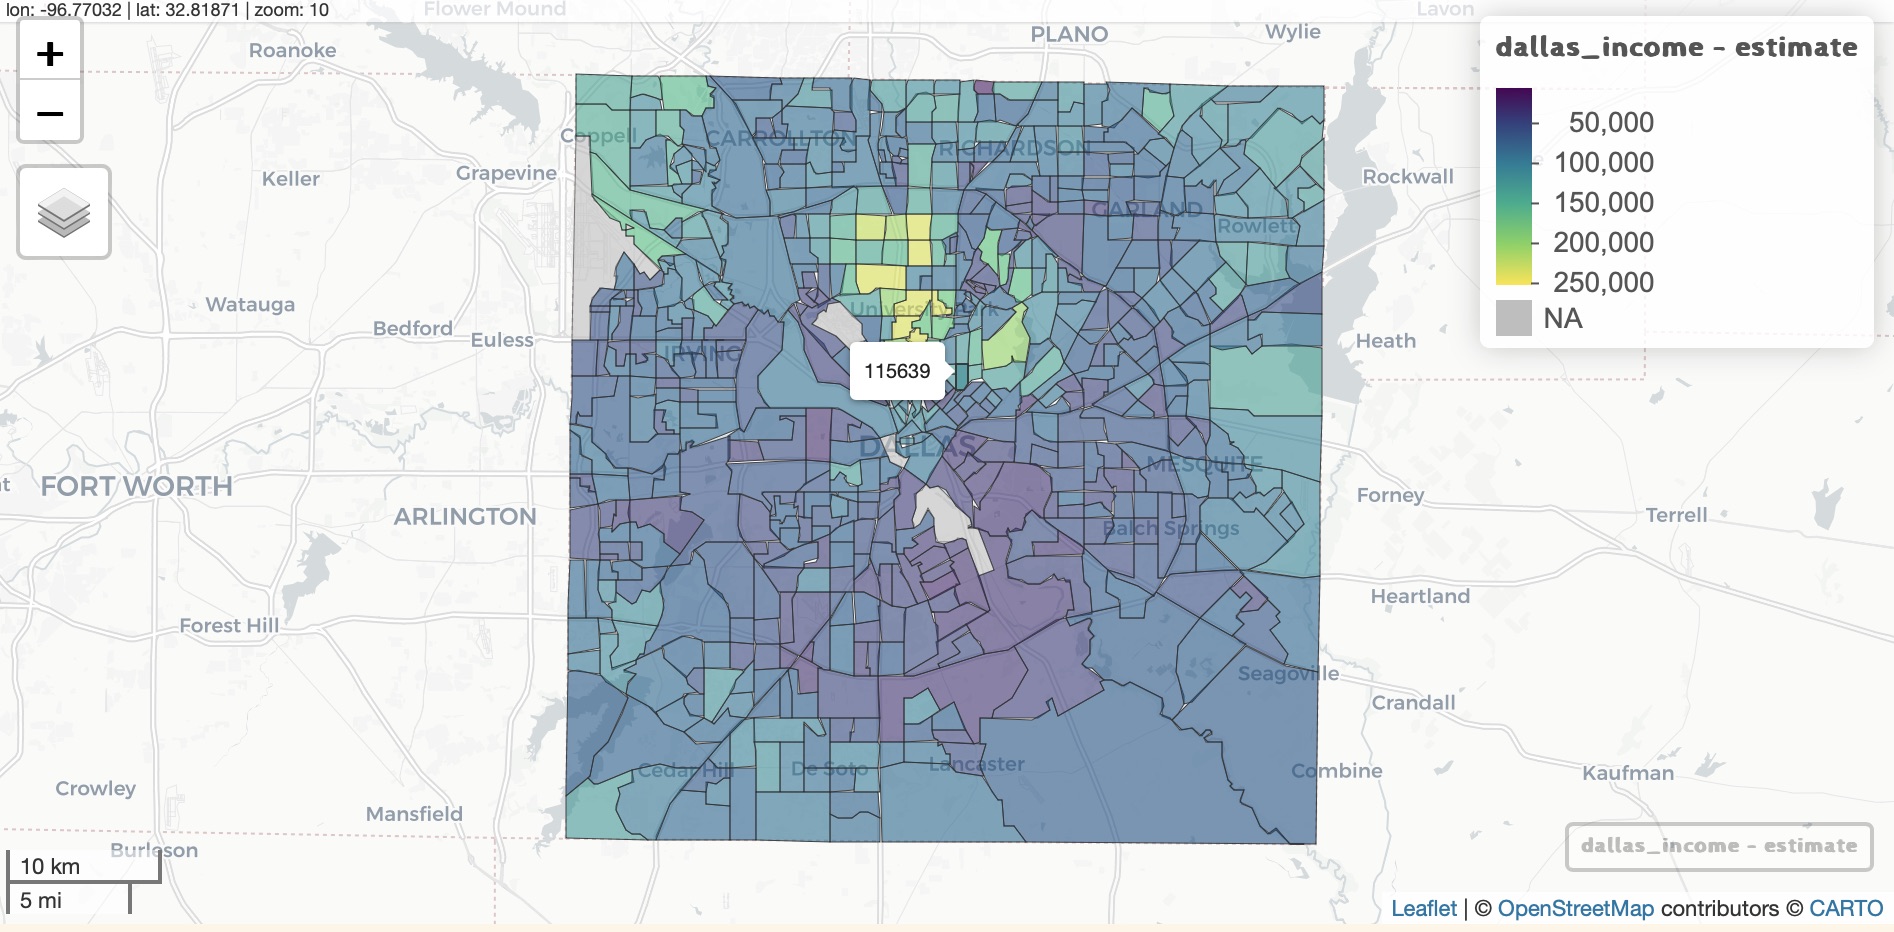
3 Interactive Dallas Income Data Map
library(mapview)

# Display interactive map of Dallas income data
mapview(dallas_income, zcol = "estimate")