require(ISLR)
require(MASS)
require(descr)
attach(Smarket)Lab04 Linear Discriminant Analysis Lab
1 Introduction
This document provides a tutorial on using Linear Discriminant Analysis (LDA) to predict stock market directions using the Smarket dataset from the ISLR package. The dataset includes stock market data from 2001 to 2005, and we’ll build a model to predict whether the market will go up or down based on lag variables.
2 Setup
First, we need to load the necessary packages and attach the Smarket dataset.
3 Frequency of Market Direction
We start by inspecting the frequency of the Direction variable, which indicates whether the market went up or down.
freq(Direction)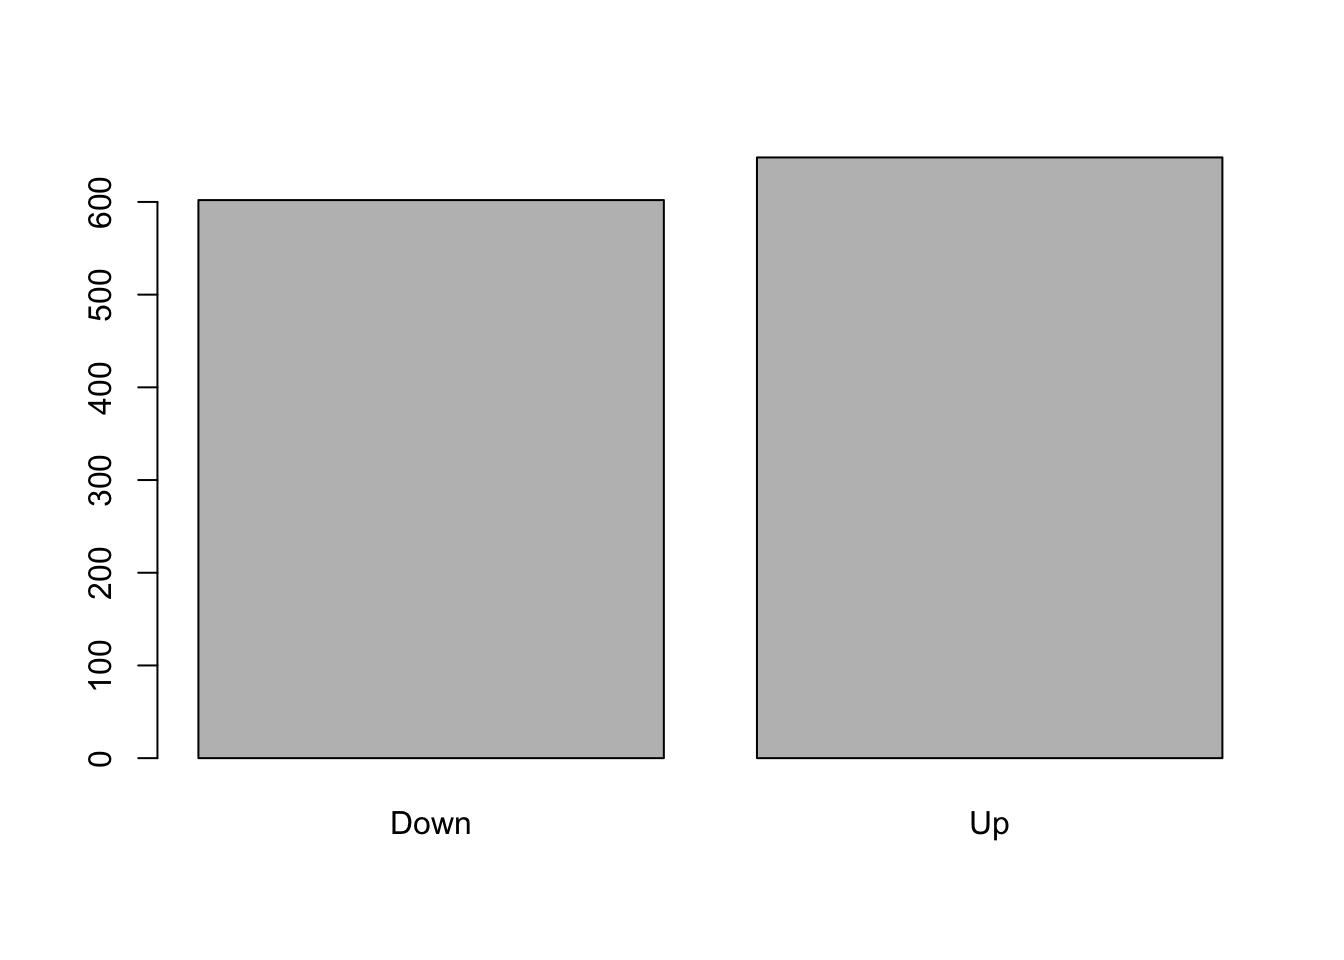
Direction
      Frequency Percent
Down        602   48.16
Up          648   51.84
Total      1250  100.00
4 Linear Discriminant Analysis Model
We now fit a Linear Discriminant Analysis (LDA) model using the Lag1 and Lag2 features to predict the Direction of the market. We’ll train the model using data from 2001 to 2004, and test it on data from 2005.
# Define training data (years before 2005)
train = Year < 2005

# Fit the LDA model
lda.fit = lda(Direction ~ Lag1 + Lag2, data = Smarket, subset = Year < 2005)

# Print model summary
lda.fit
Call:
lda(Direction ~ Lag1 + Lag2, data = Smarket, subset = Year <
2005)
Prior probabilities of groups:
Down Up
0.491984 0.508016
Group means:
Lag1 Lag2
Down 0.04279022 0.03389409
Up -0.03954635 -0.03132544
Coefficients of linear discriminants:
LD1
Lag1 -0.6420190
Lag2 -0.51352935 Visualizing the LDA Model
We can visualize the LDA decision boundaries using the following plot:
plot(lda.fit, col = "dodgerblue")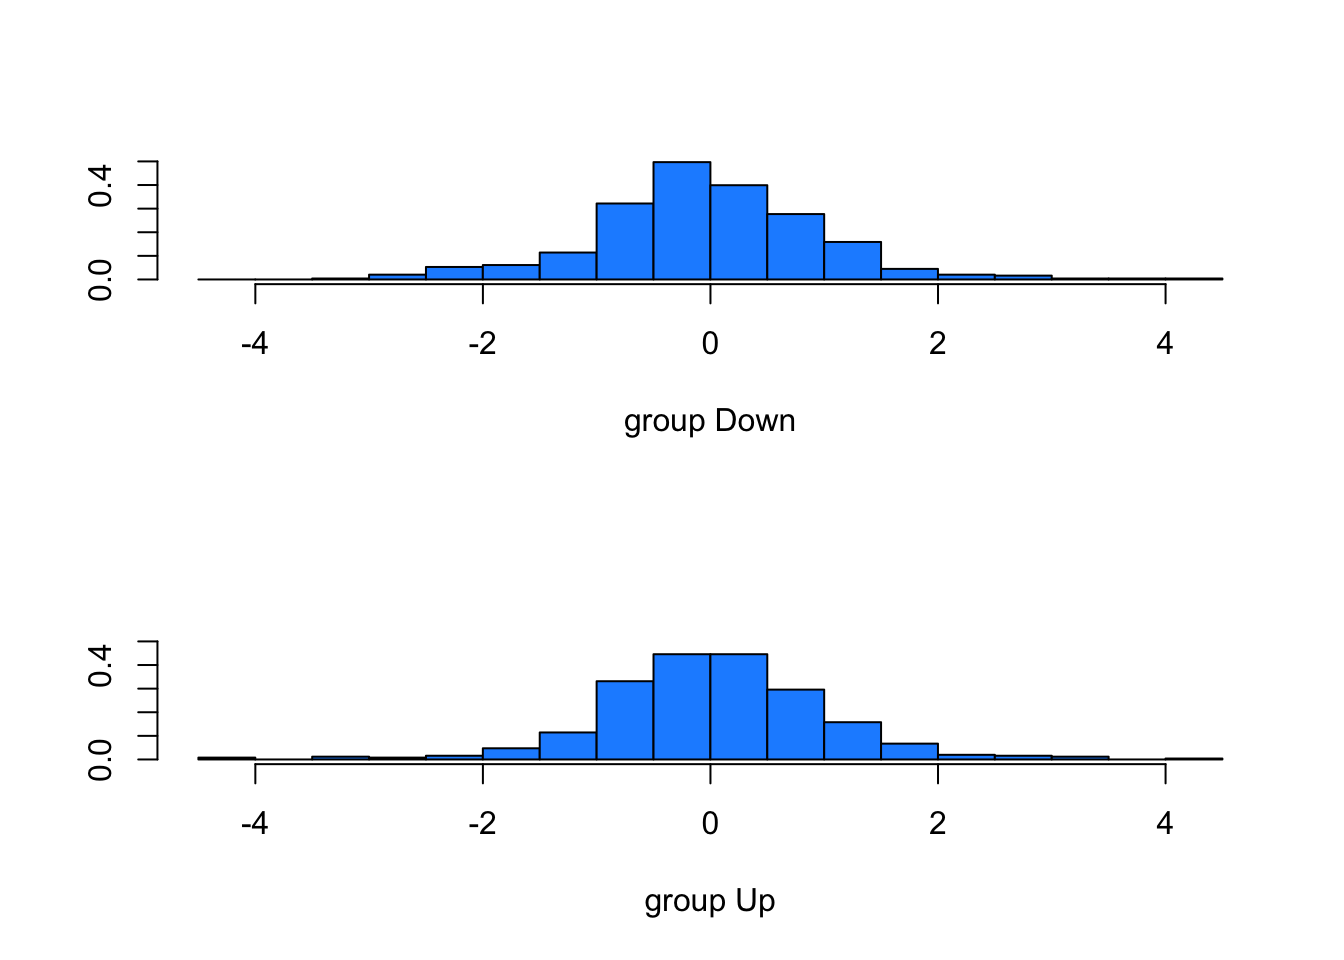
6 Predictions for 2005
Now we create a subset of the data for 2005 and use the trained LDA model to predict the market direction for that year.
# Subset data for 2005
Smarket.2005 = subset(Smarket, Year == 2005)

# Predict market direction using the LDA model
lda.pred = predict(lda.fit, Smarket.2005)

# Display prediction details
names(lda.pred)
[1] "class" "posterior" "x" # Predicted classes
lda.class = lda.pred$class7 Confusion Matrix
We can now compare the predicted market direction with the actual direction in 2005 using a confusion matrix:
# Actual market direction for 2005
Direction.2005 = Smarket$Direction[!train]

# Confusion matrix
table(lda.class, Direction.2005)
Direction.2005
lda.class Down Up
Down 35 35
Up 76 1068 Model Performance
Finally, we calculate the model’s accuracy by comparing the predicted classes with the actual market direction:
# Display first 5 predictions
data.frame(lda.pred)[1:5, ]
class posterior.Down posterior.Up LD1
999 Up 0.4901792 0.5098208 0.08293096
1000 Up 0.4792185 0.5207815 0.59114102
1001 Up 0.4668185 0.5331815 1.16723063
1002 Up 0.4740011 0.5259989 0.83335022
1003 Up 0.4927877 0.5072123 -0.03792892# Accuracy of the LDA model on 2005 data
mean(lda.pred$class == Smarket.2005$Direction)[1] 0.55952389 Conclusion
In this lab, we have implemented Linear Discriminant Analysis (LDA) to predict stock market direction based on lag variables. We used historical data from 2001 to 2004 for training and tested the model on 2005 data. We visualized the LDA decision boundaries, made predictions, and evaluated the model’s accuracy.