Lab 05: Digital Data and Table Operations
1 Introduction
This lab focuses on the use of digital data and performing basic table operations in GIS. It involves manipulating different data sets and creating maps that represent various geographic and population-related data.
2 Objectives
- Explore different types of digital data sets.
- Perform basic table operations in ArcGIS.
- Create and interpret thematic maps.
3 Tasks
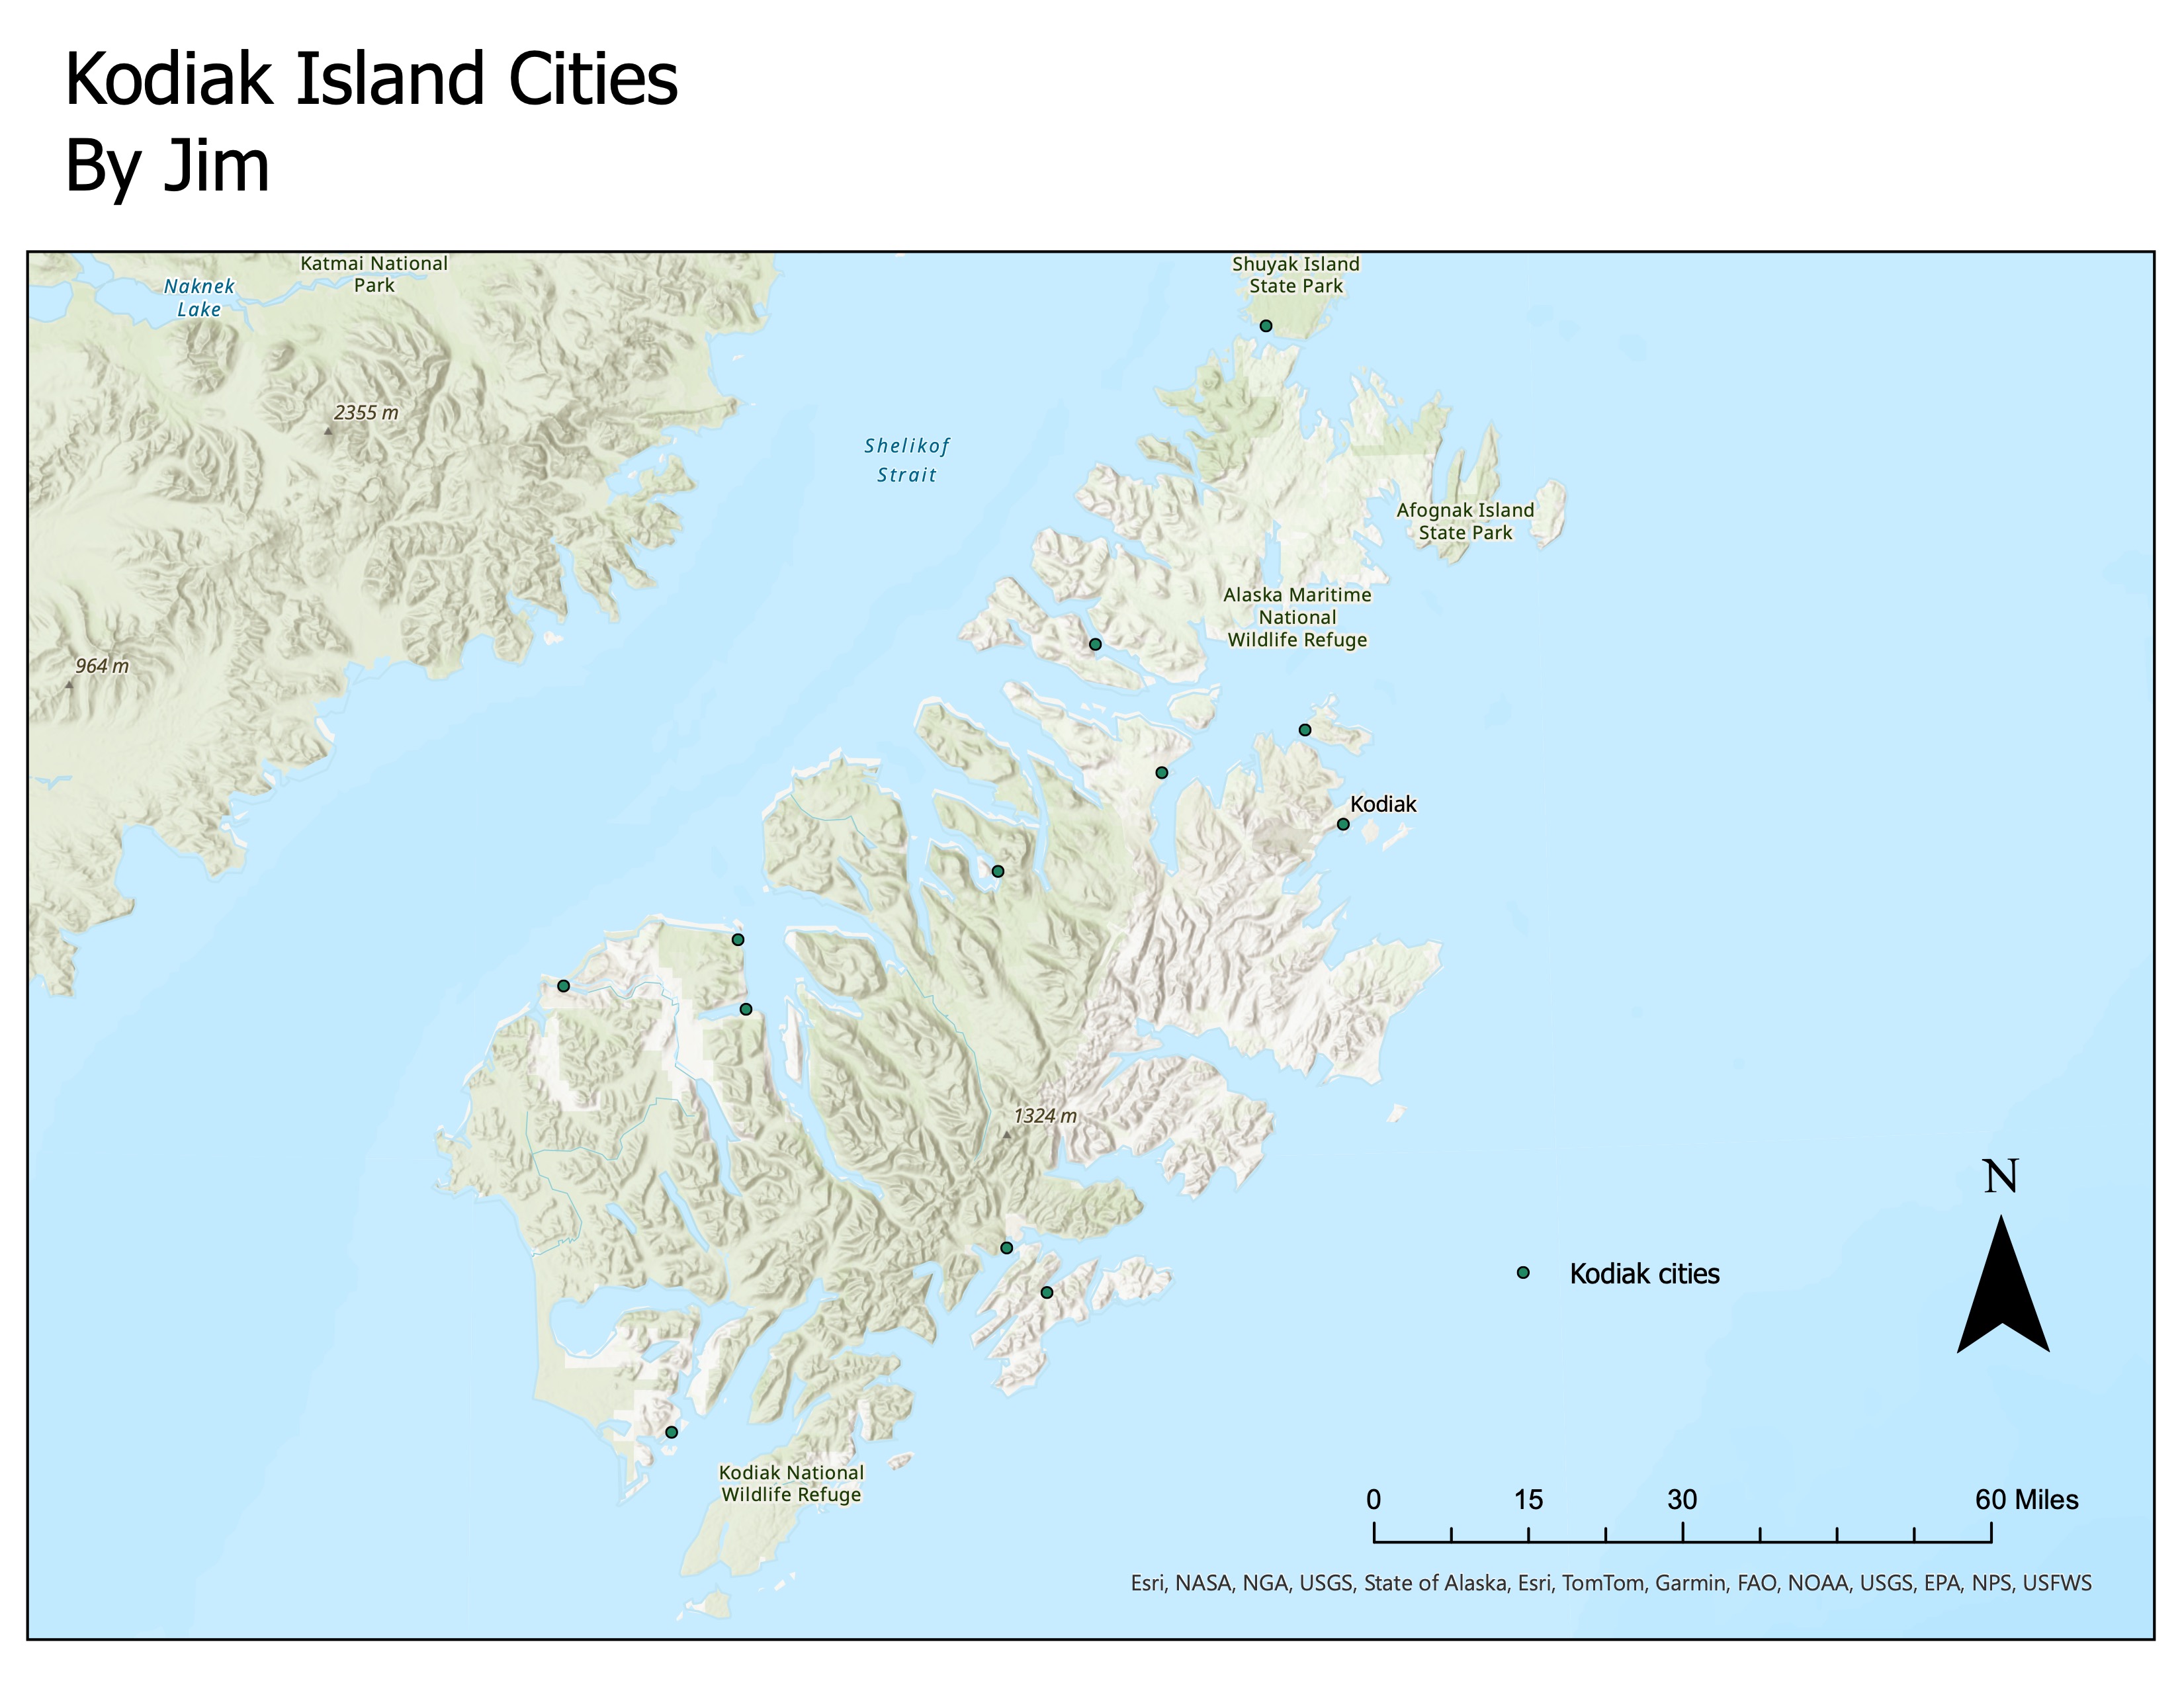
3.1 1. Kodiak Island Cities
A map was created using USGS data to identify cities on Kodiak Island, Alaska. The cities were selected and saved as a subset.
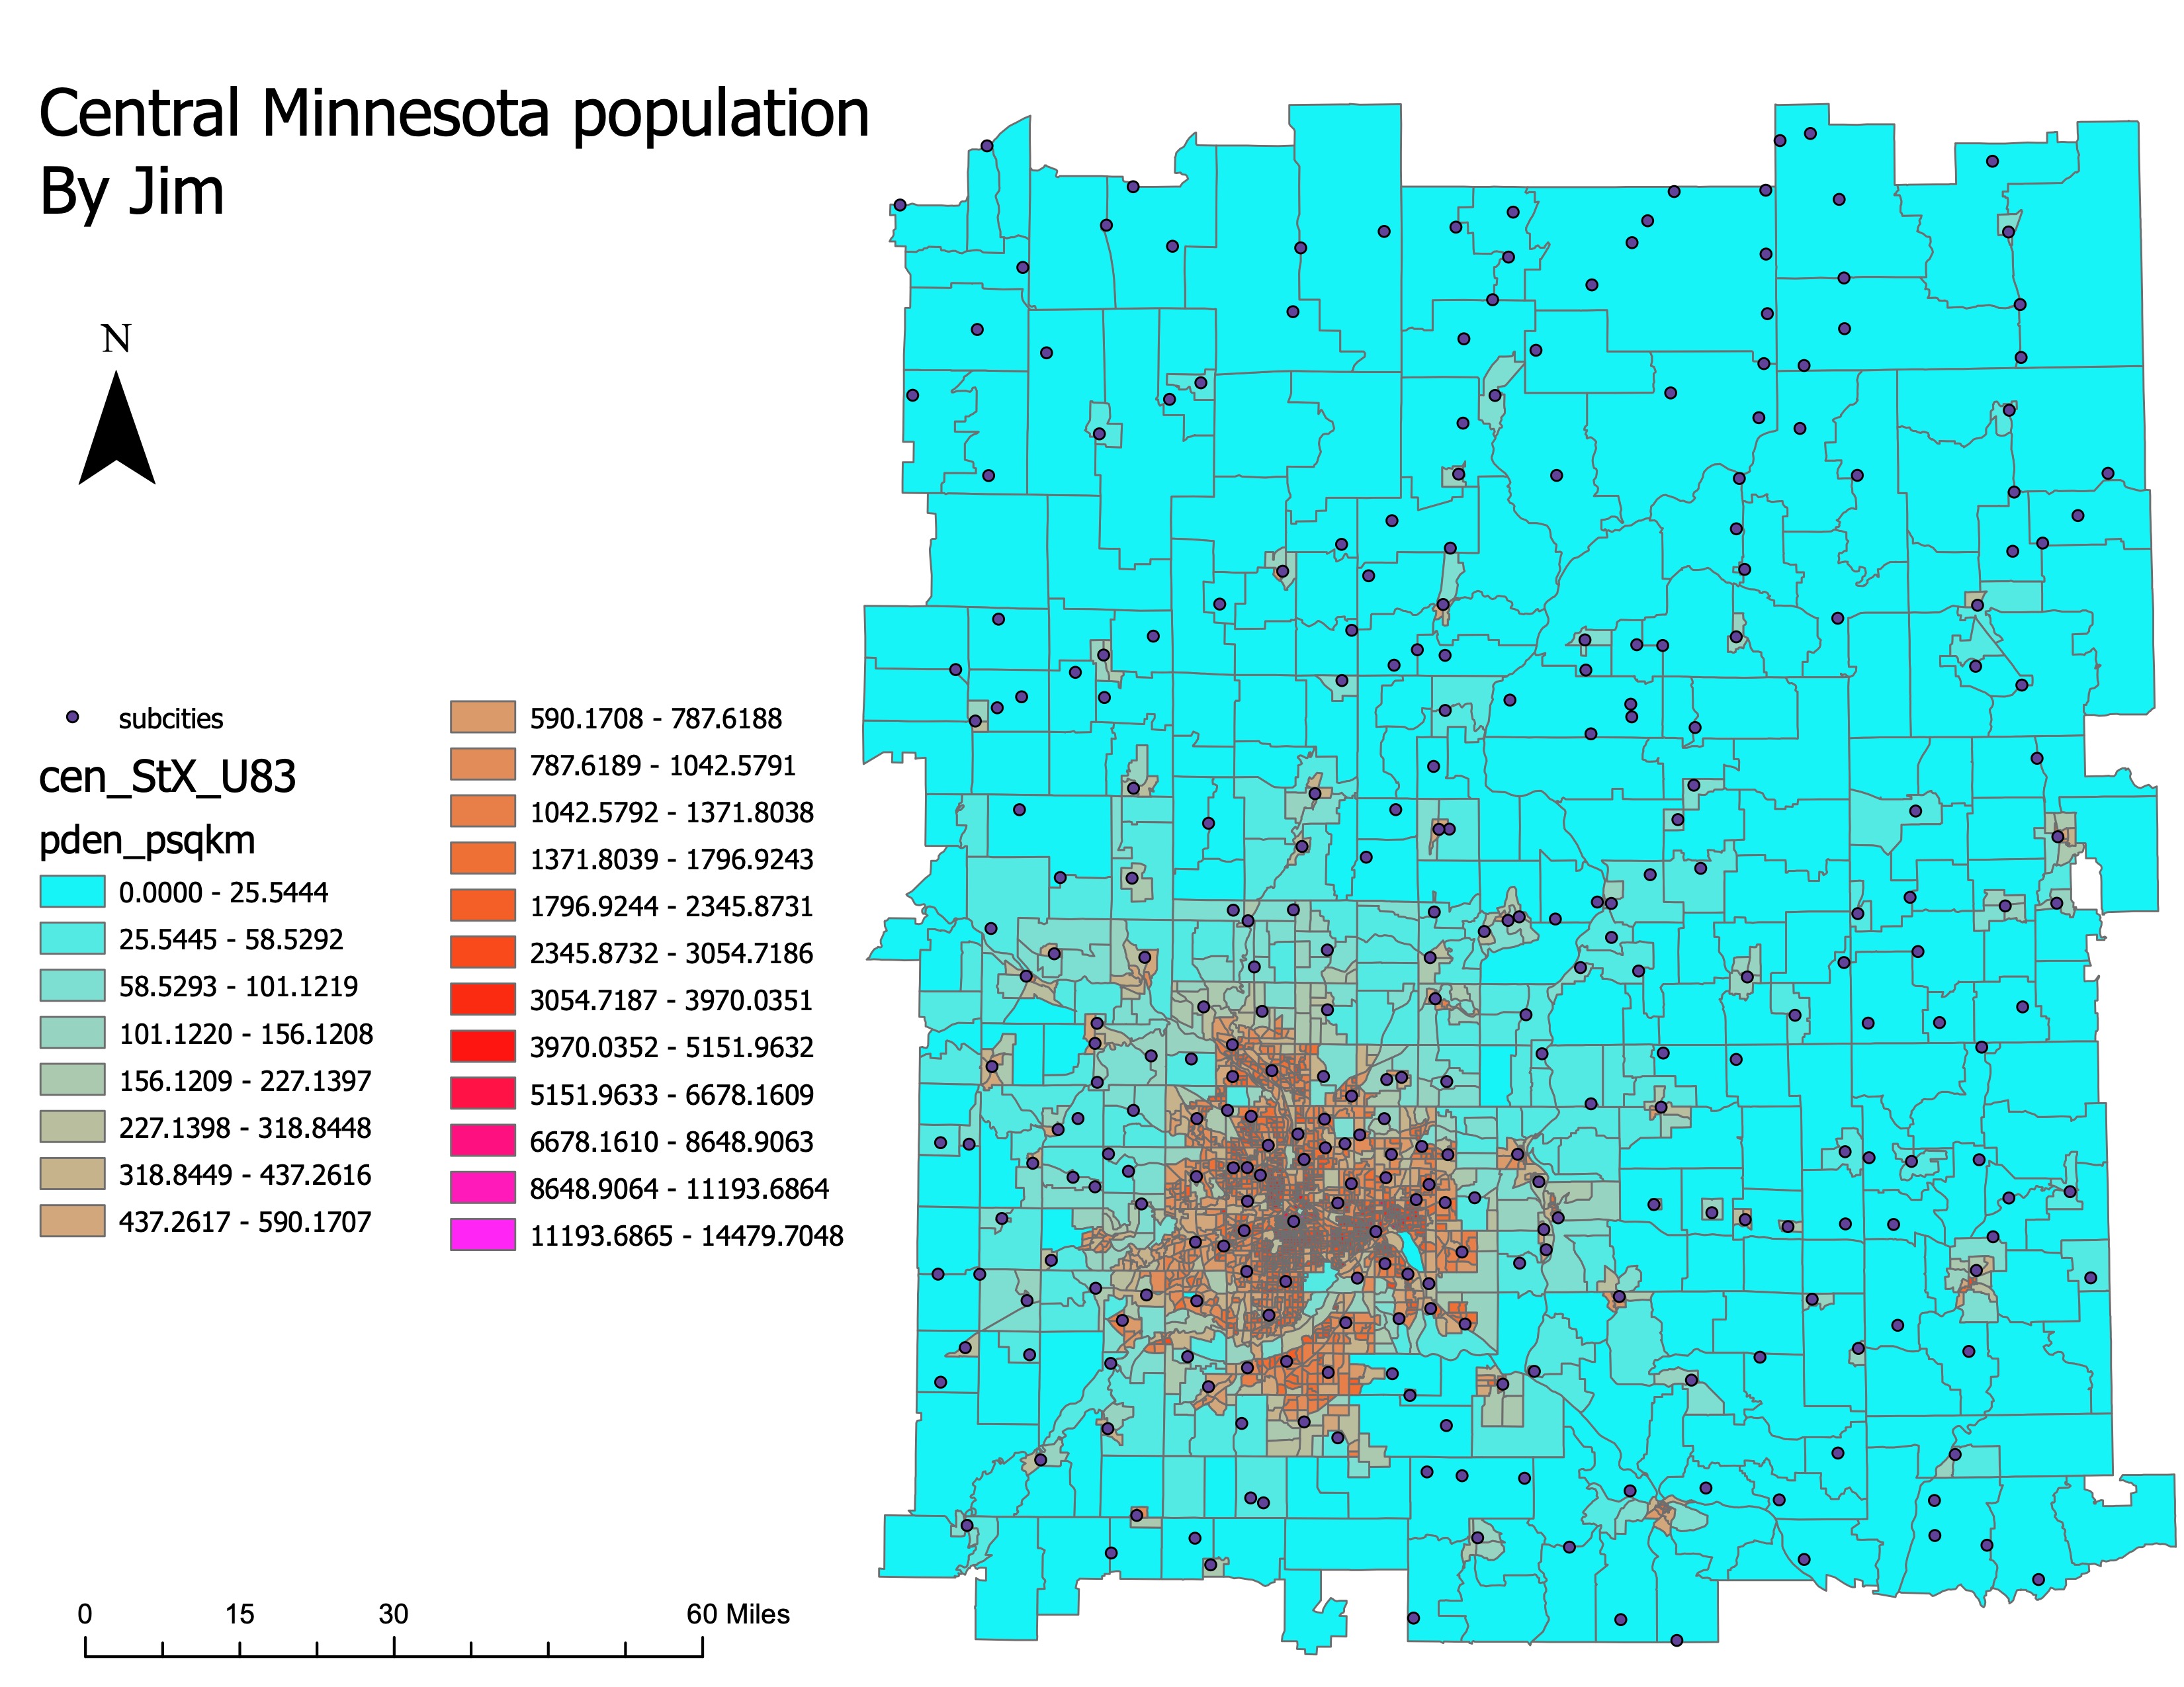
3.2 2. Population Density Map
Using U.S. census data, a population density map was generated, highlighting the varying population densities across different regions.
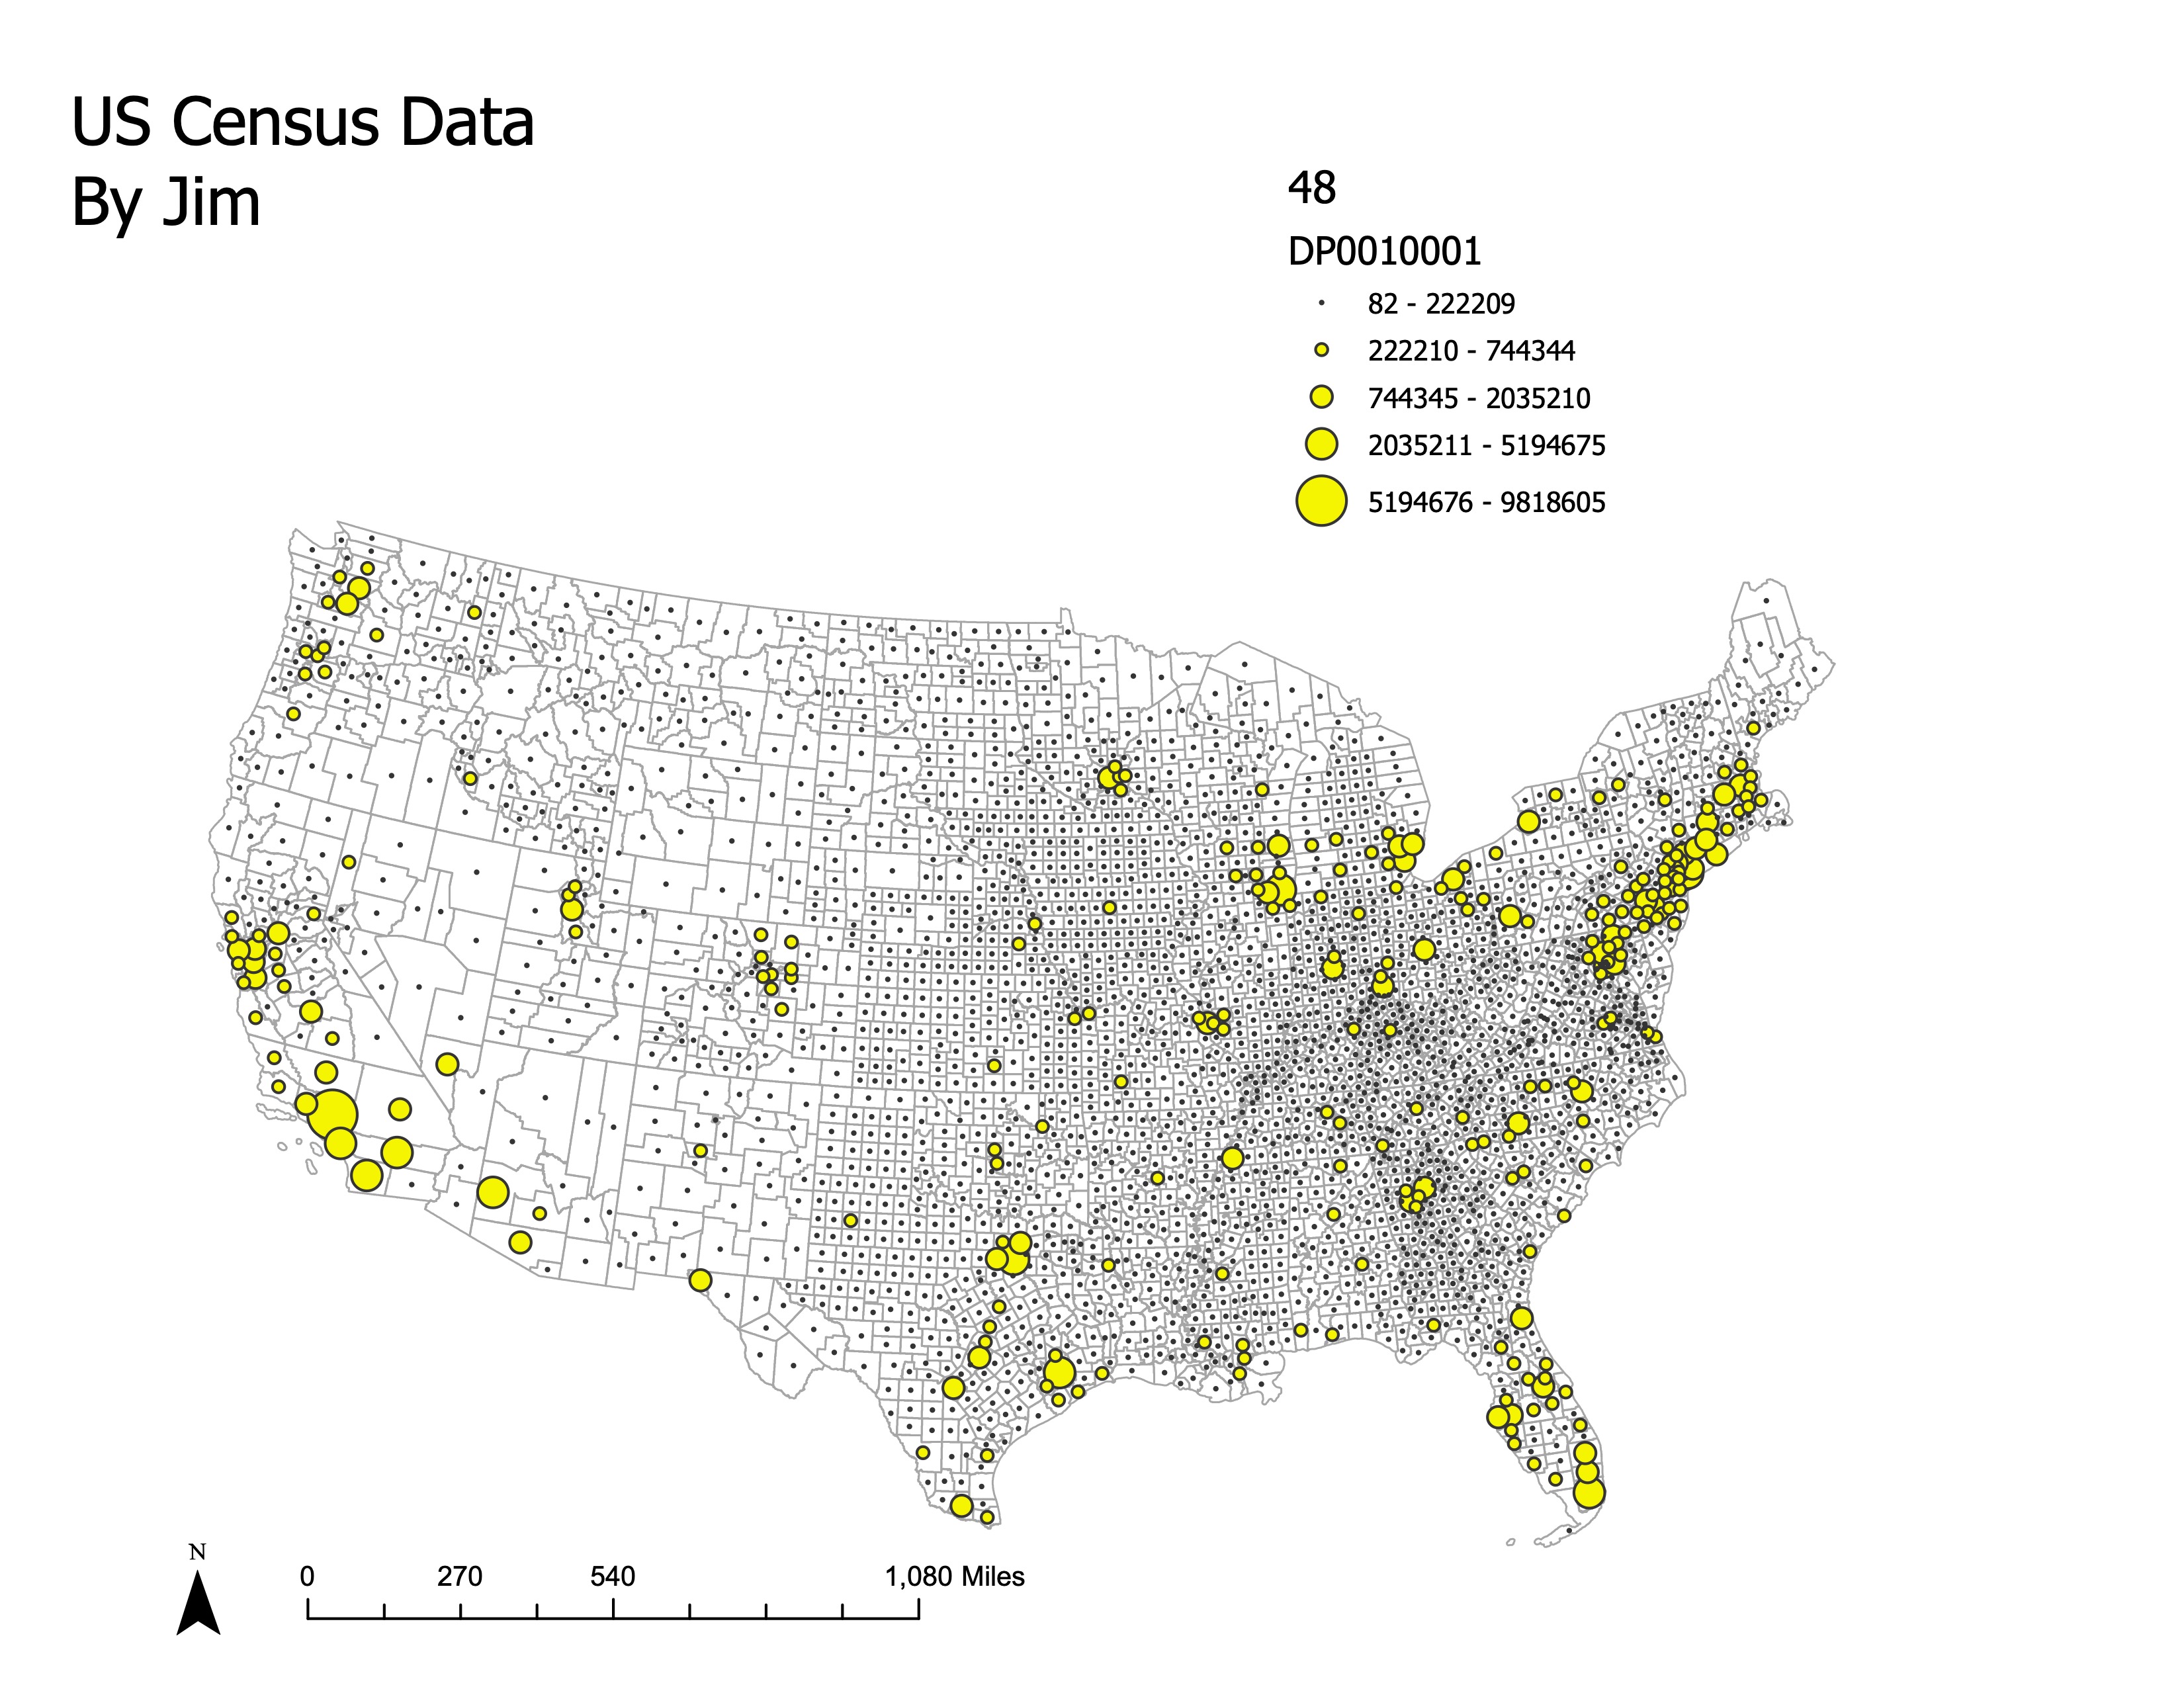
3.3 3. County Population Symbol Map
A proportional symbol map was created to display county population for the lower 48 U.S. states.
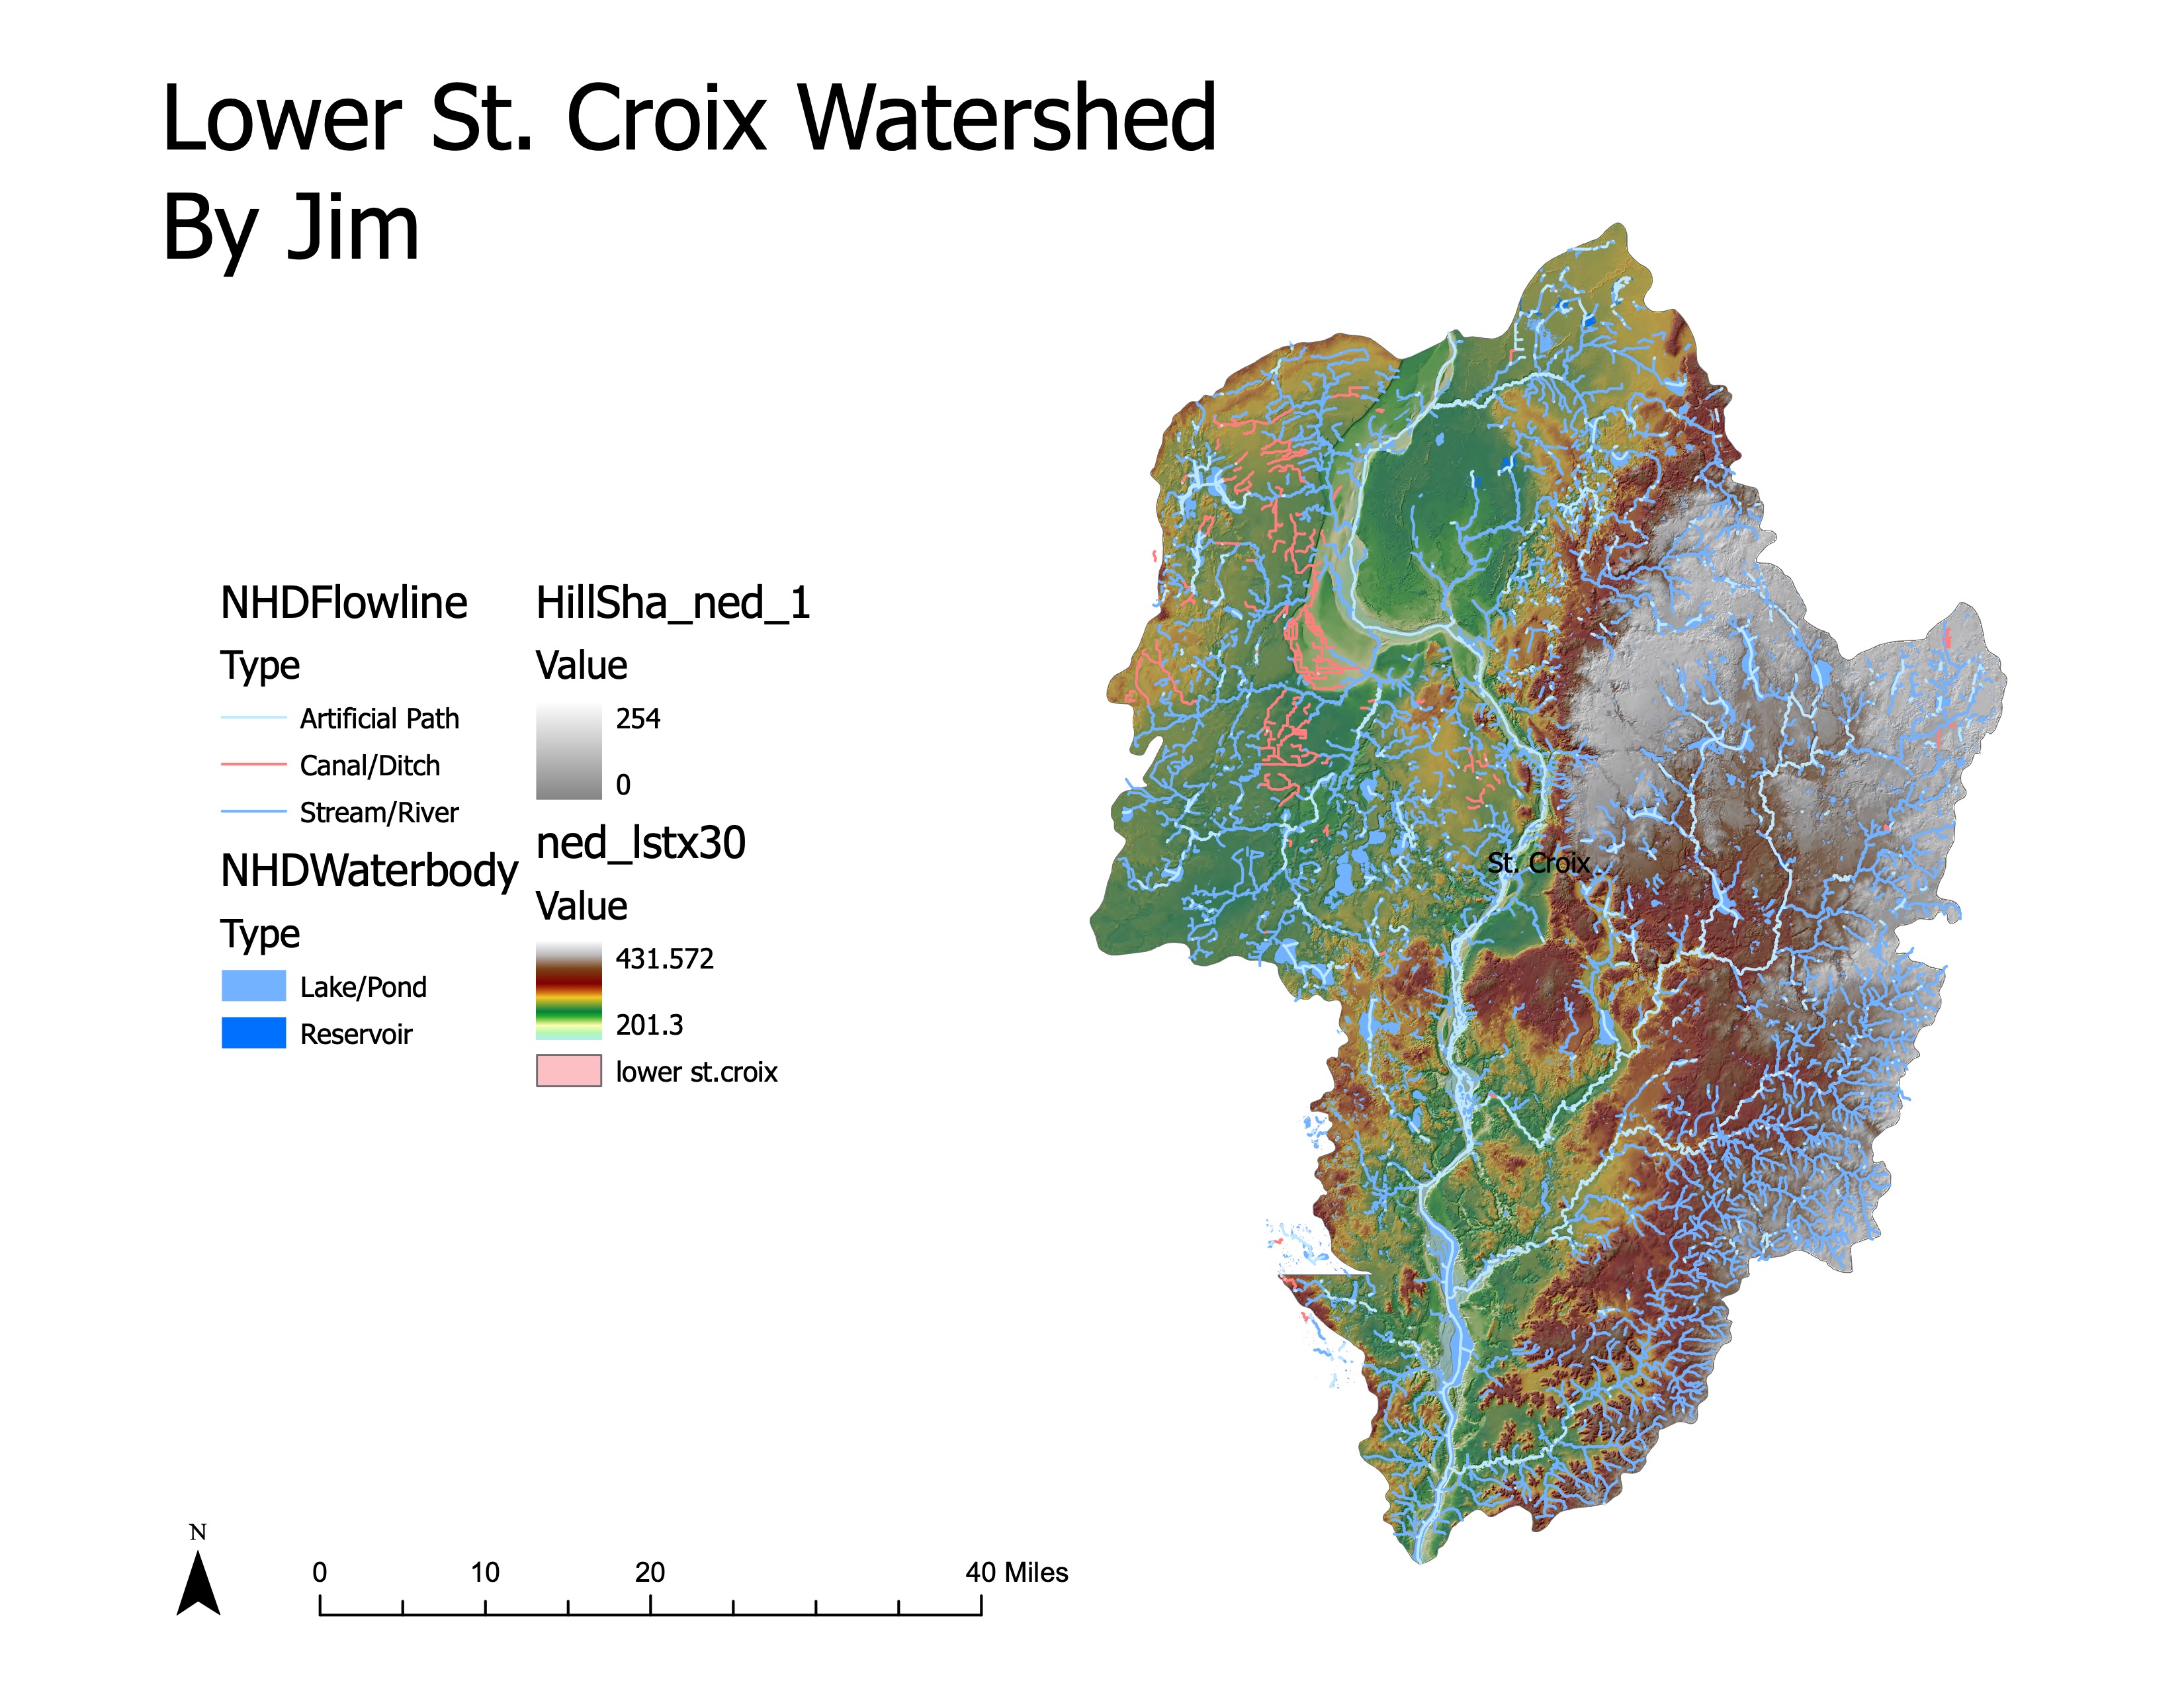
3.4 4. Shaded Relief and Hydrography Map
Digital elevation and hydrological data were utilized to create a shaded-relief map, enhancing the visual representation of the terrain.
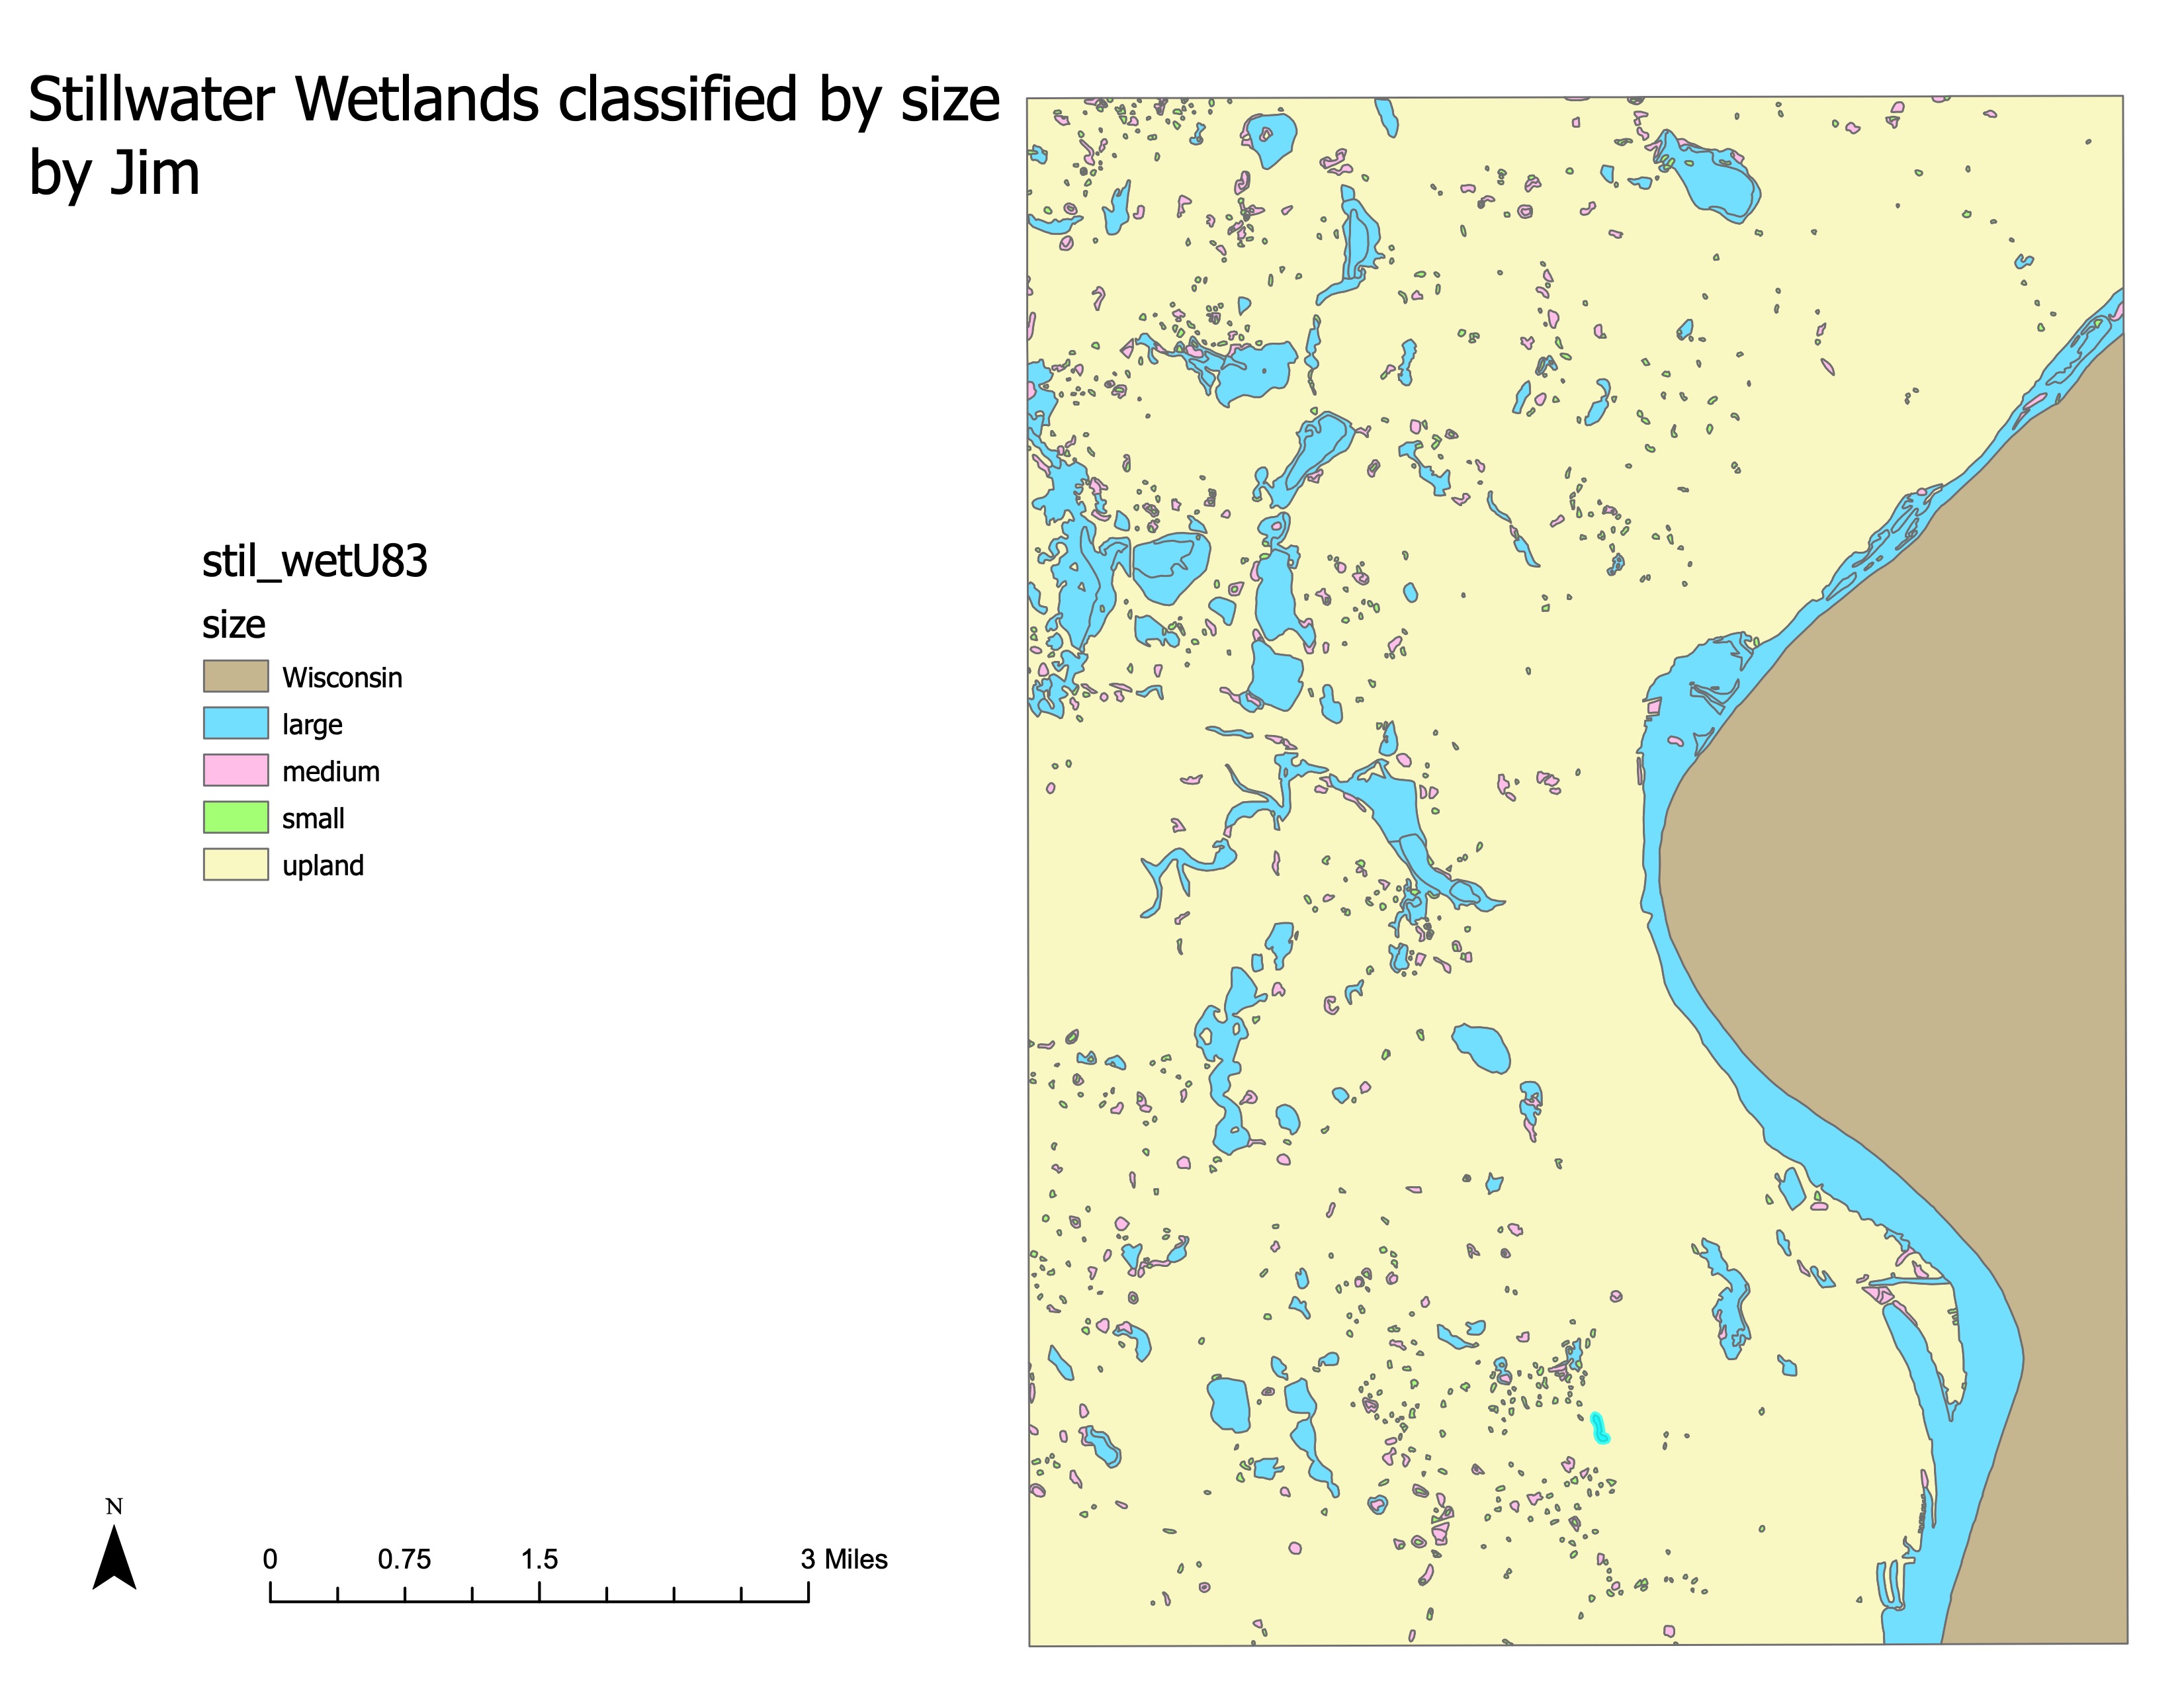
3.5 5. Wetlands by Size Class
Wetlands data were classified by size, and a map was produced to display the various size classes of wetlands.
4 Results
4.0.1 Central Minnesota Population
4.0.2 Lower St. Croix Watershed
4.0.3 Kodiak Island Cities
4.0.4 U.S. Census Data
4.0.5 Stillwater Wetlands by Size
5 Conclusion
This lab provided practical experience in handling various digital data sets and performing basic table operations in ArcGIS. Through the creation of multiple thematic maps, key skills in data manipulation and visualization were developed, which are essential for effective spatial analysis.