Lab 10: Remote Sensing Data Analysis
1 Introduction
In this lab, we explore the use of Landsat 9 imagery for remote sensing data analysis. We will focus on downloading, displaying, and analyzing Landsat data using ArcGIS Pro, including creating composite images and conducting change detection analysis.
2 Objectives
- Learn how to download and process Landsat 9 imagery.
- Understand the methods for displaying and analyzing remote sensing data in ArcGIS Pro.
- Create composite images using multiple Landsat bands.
- Perform change detection analysis to assess land cover changes over time.
3 Tasks
3.1 1. Downloading Landsat Imagery
Using the Earth Explorer tool, download Landsat 9 imagery for a region of interest. For this lab, the target area is Dallas, Texas.
3.2 2. Displaying Landsat Imagery in ArcGIS Pro
Load the downloaded Landsat 9 imagery into ArcGIS Pro and explore various methods for displaying and analyzing the data. Specifically, create a composite image using the different spectral bands provided by the Landsat dataset.
3.3 3. Creating a Composite Image
Utilize the geoprocessing tools in ArcGIS Pro to combine the individual Landsat bands into a single composite image. The composite image will allow us to visualize the area using different spectral bands and understand the various land cover features.
3.4 4. Change Detection Analysis
Conduct a change detection analysis using Landsat imagery from 2014 and 2024 for the Dallas area. The goal is to identify land cover changes over the past decade. The change detection process will involve comparing specific spectral bands from the two different time periods.
4 Results
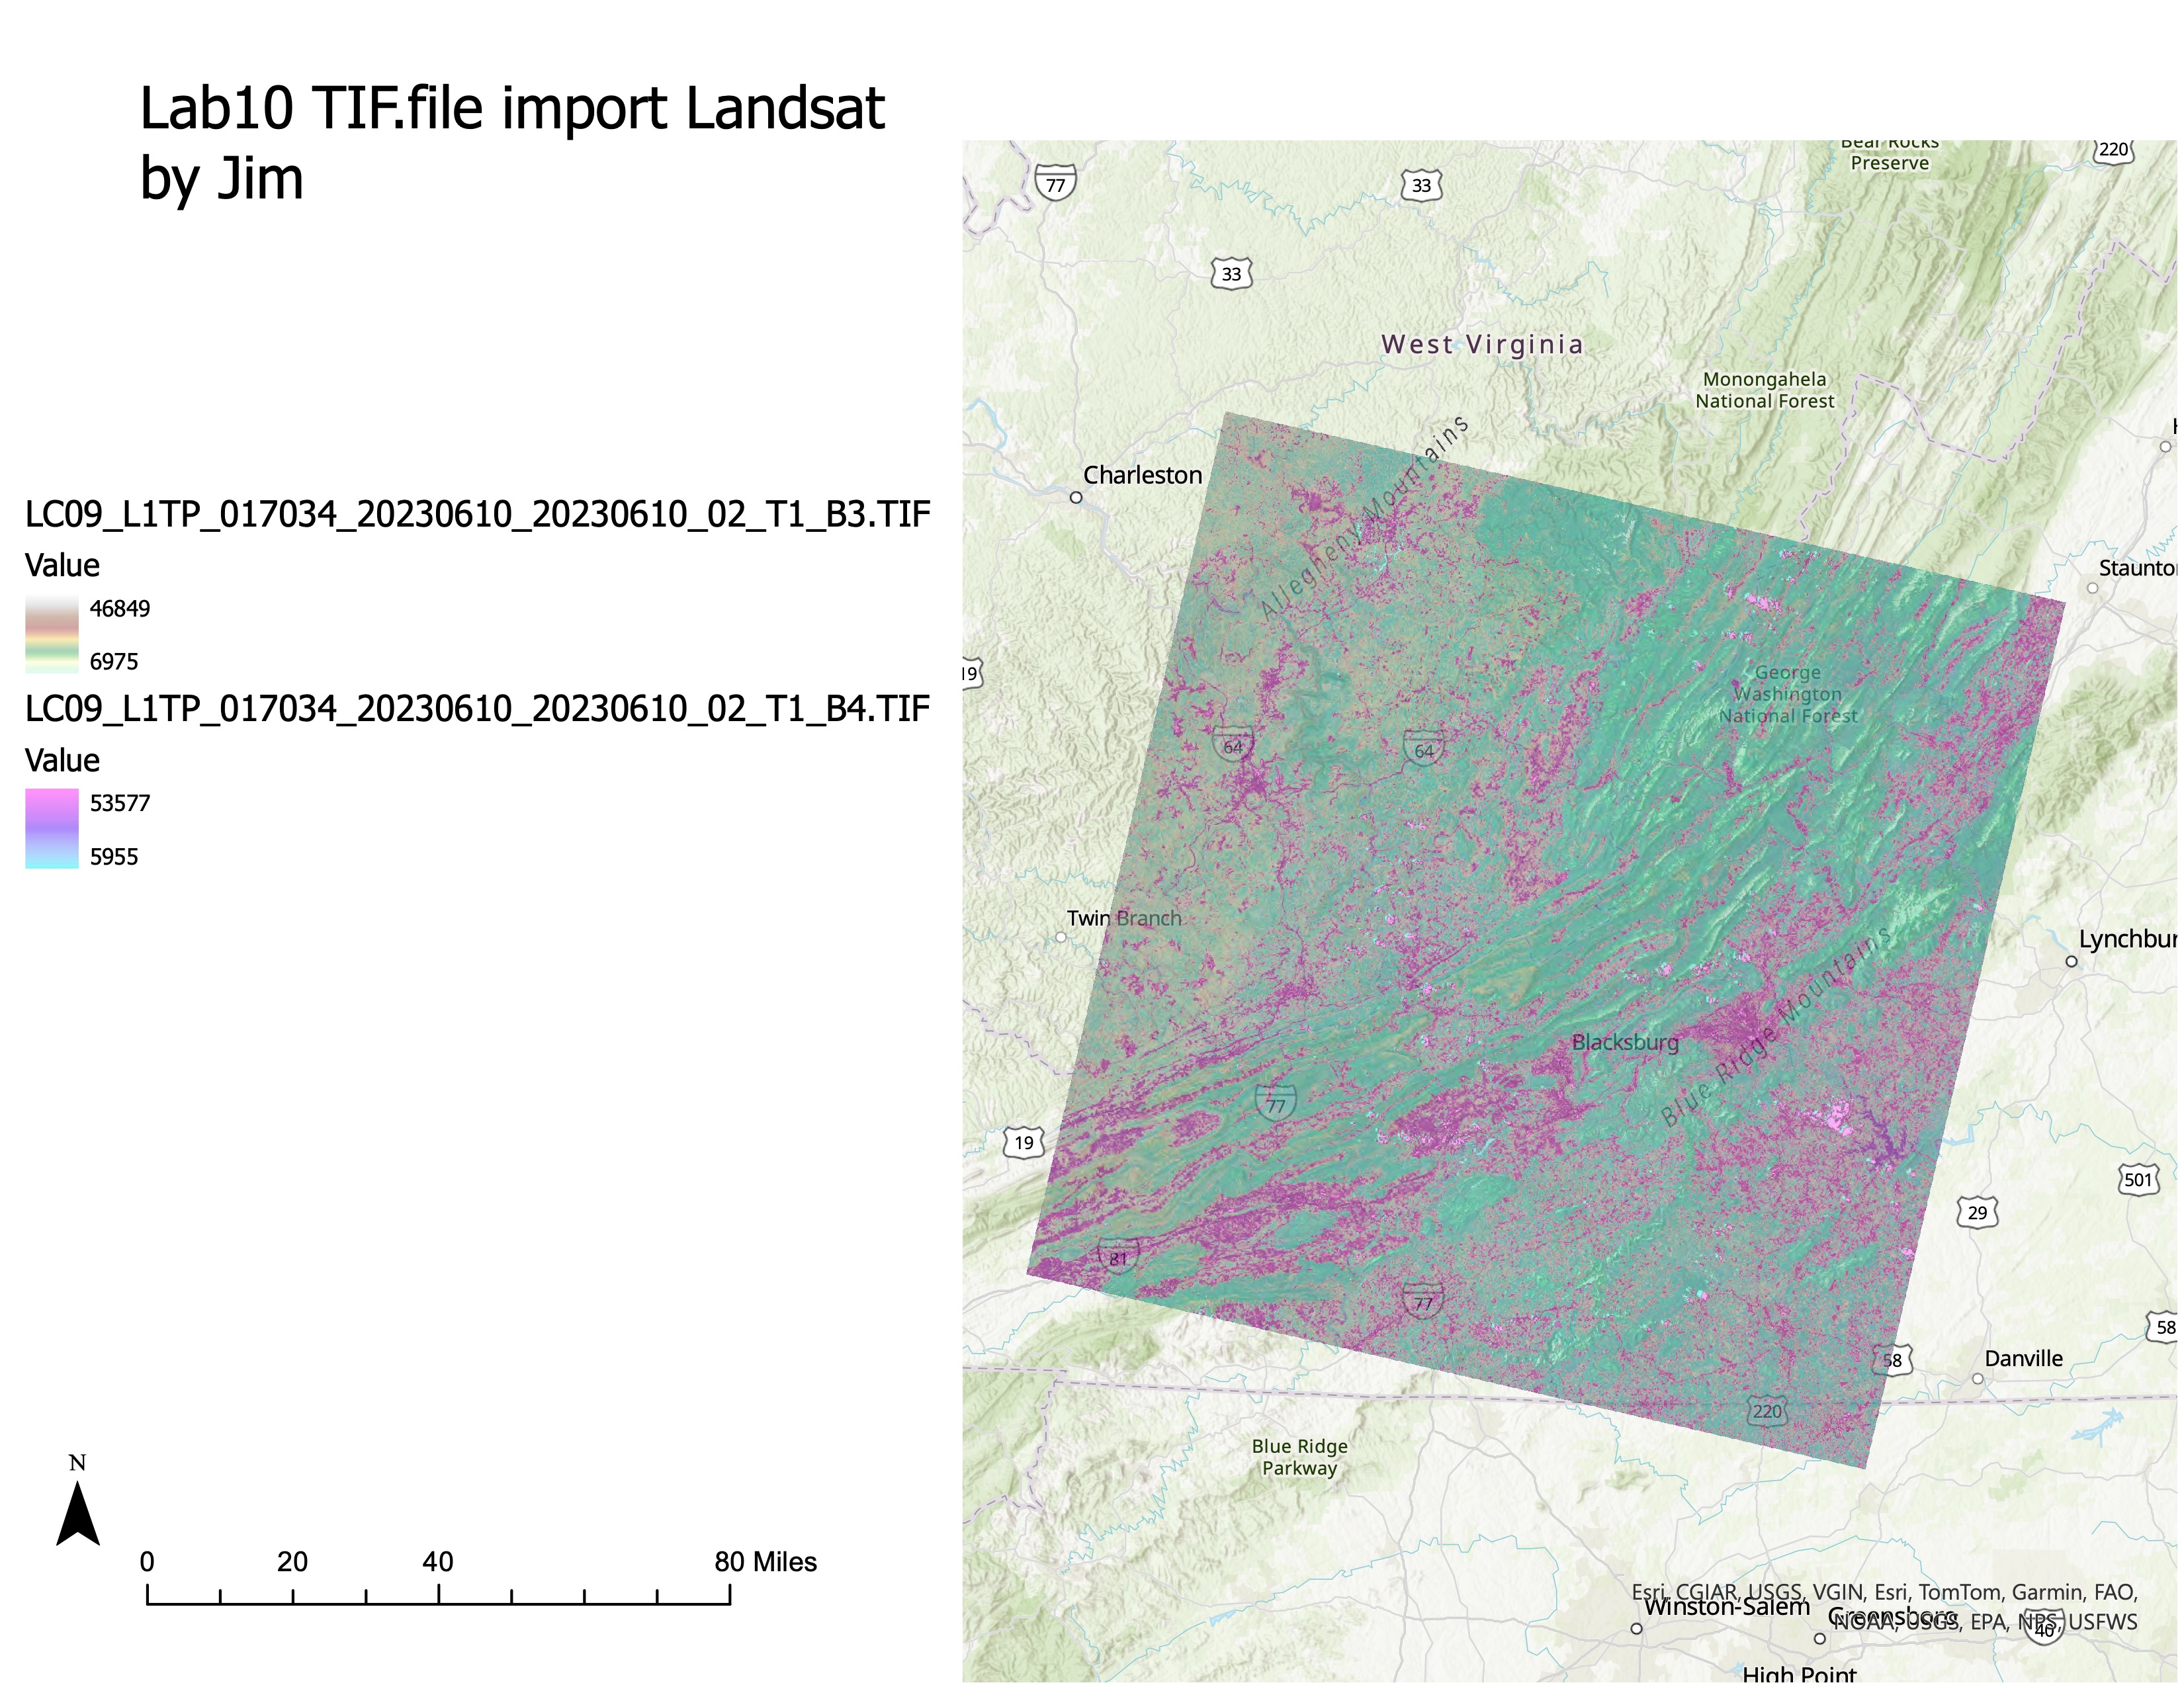
4.0.1 Map: Adding and Exploring Landsat Imagery in ArcGIS Pro
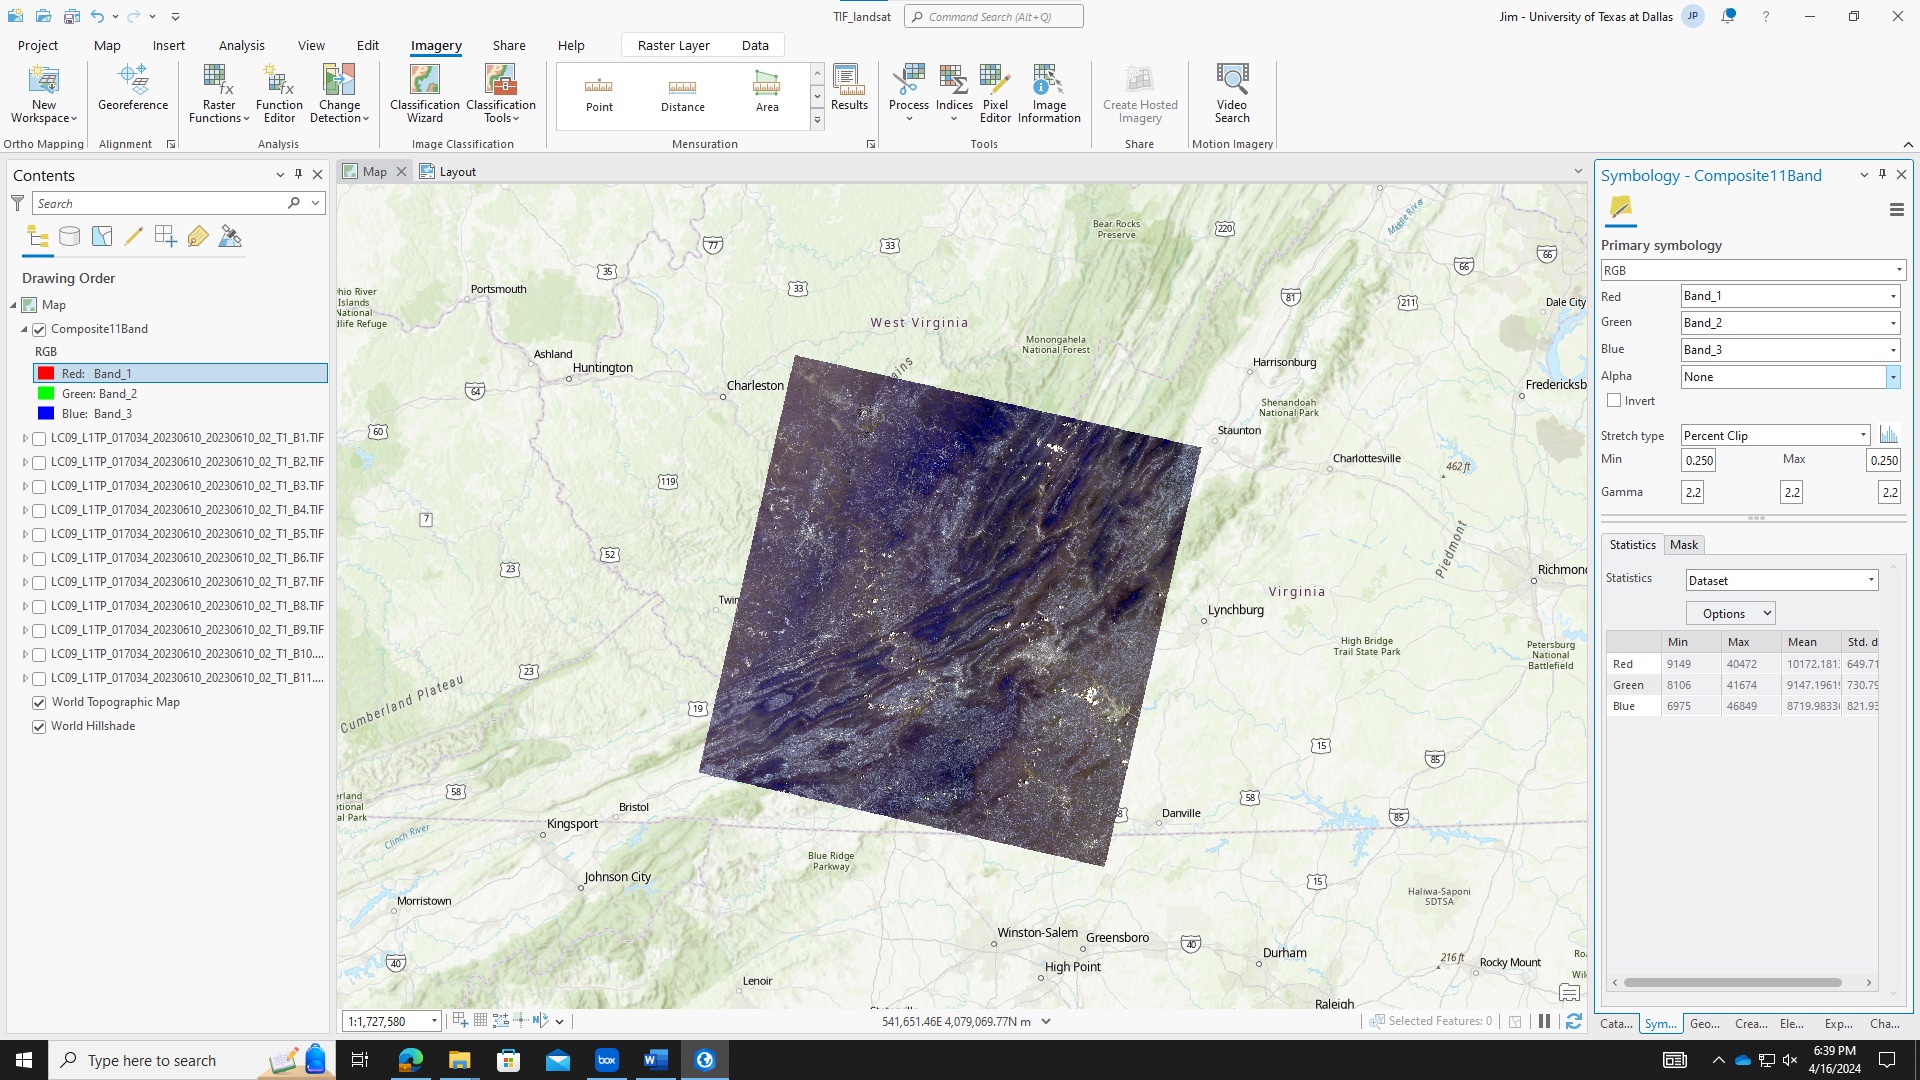
4.0.2 Sceenshot: Composite Image
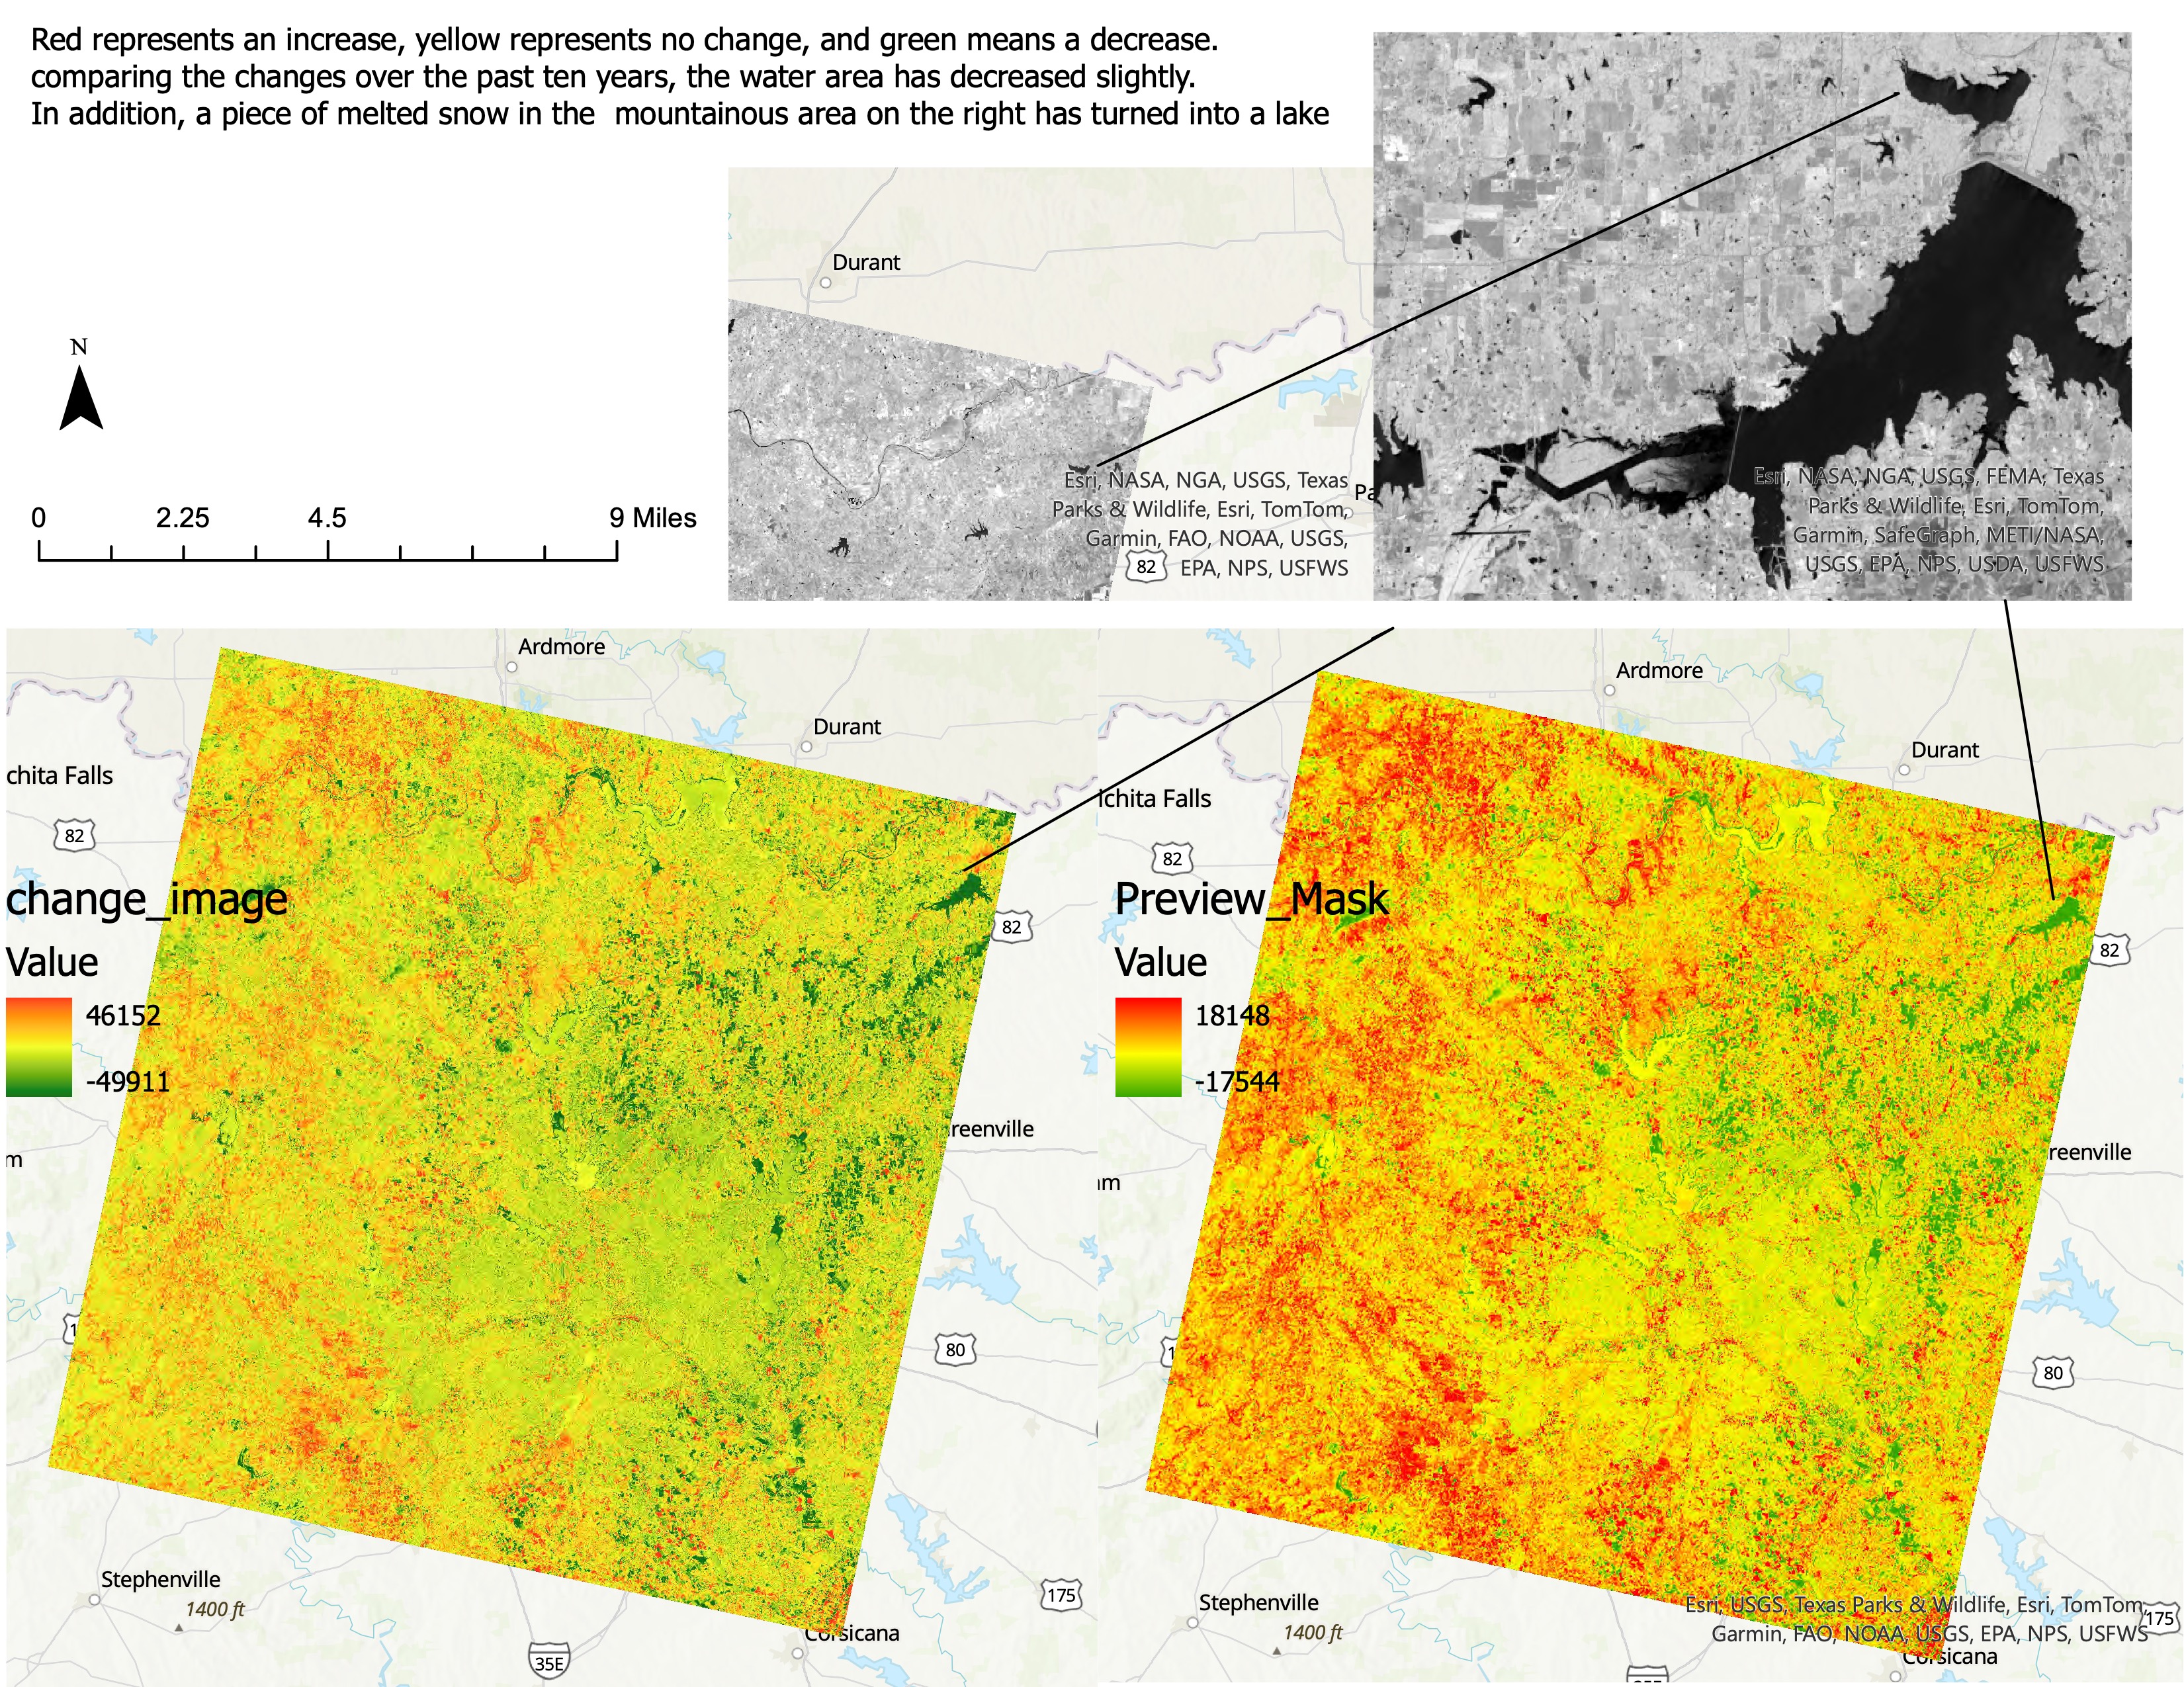
4.0.3 Map: Change Detection Analysis
5 Conclusion
The analysis performed in this lab demonstrates the capabilities of Landsat 9 imagery in remote sensing applications. By creating composite images and conducting change detection, we were able to visualize and quantify land cover changes in the Dallas area over the past decade. These techniques are crucial for monitoring environmental changes and informing decision-making processes.