Lab 06: Tables in ArcGIS
1 Introduction
This lab focuses on tabular data management in ArcGIS. It involves viewing, selecting, reordering, and updating tabular data. The lab uses the USCounties.shp data layer and the soils.shp data set for various tasks.
2 Objectives
- Practice tabular data management in ArcGIS.
- Learn how to create and join tables.
3 Tasks
3.1 1. Selecting by Attribute
Explore and select features using the Select by Attributes tool in ArcGIS. For example, create a map displaying burglary rates for each county and normalize these rates by the population.
3.2 2. Creating and Joining Tables
Create a new table containing soil properties, then join this table with the soils data layer. The joined table will be used to create a layout showing soils by fertility class.
4 Results
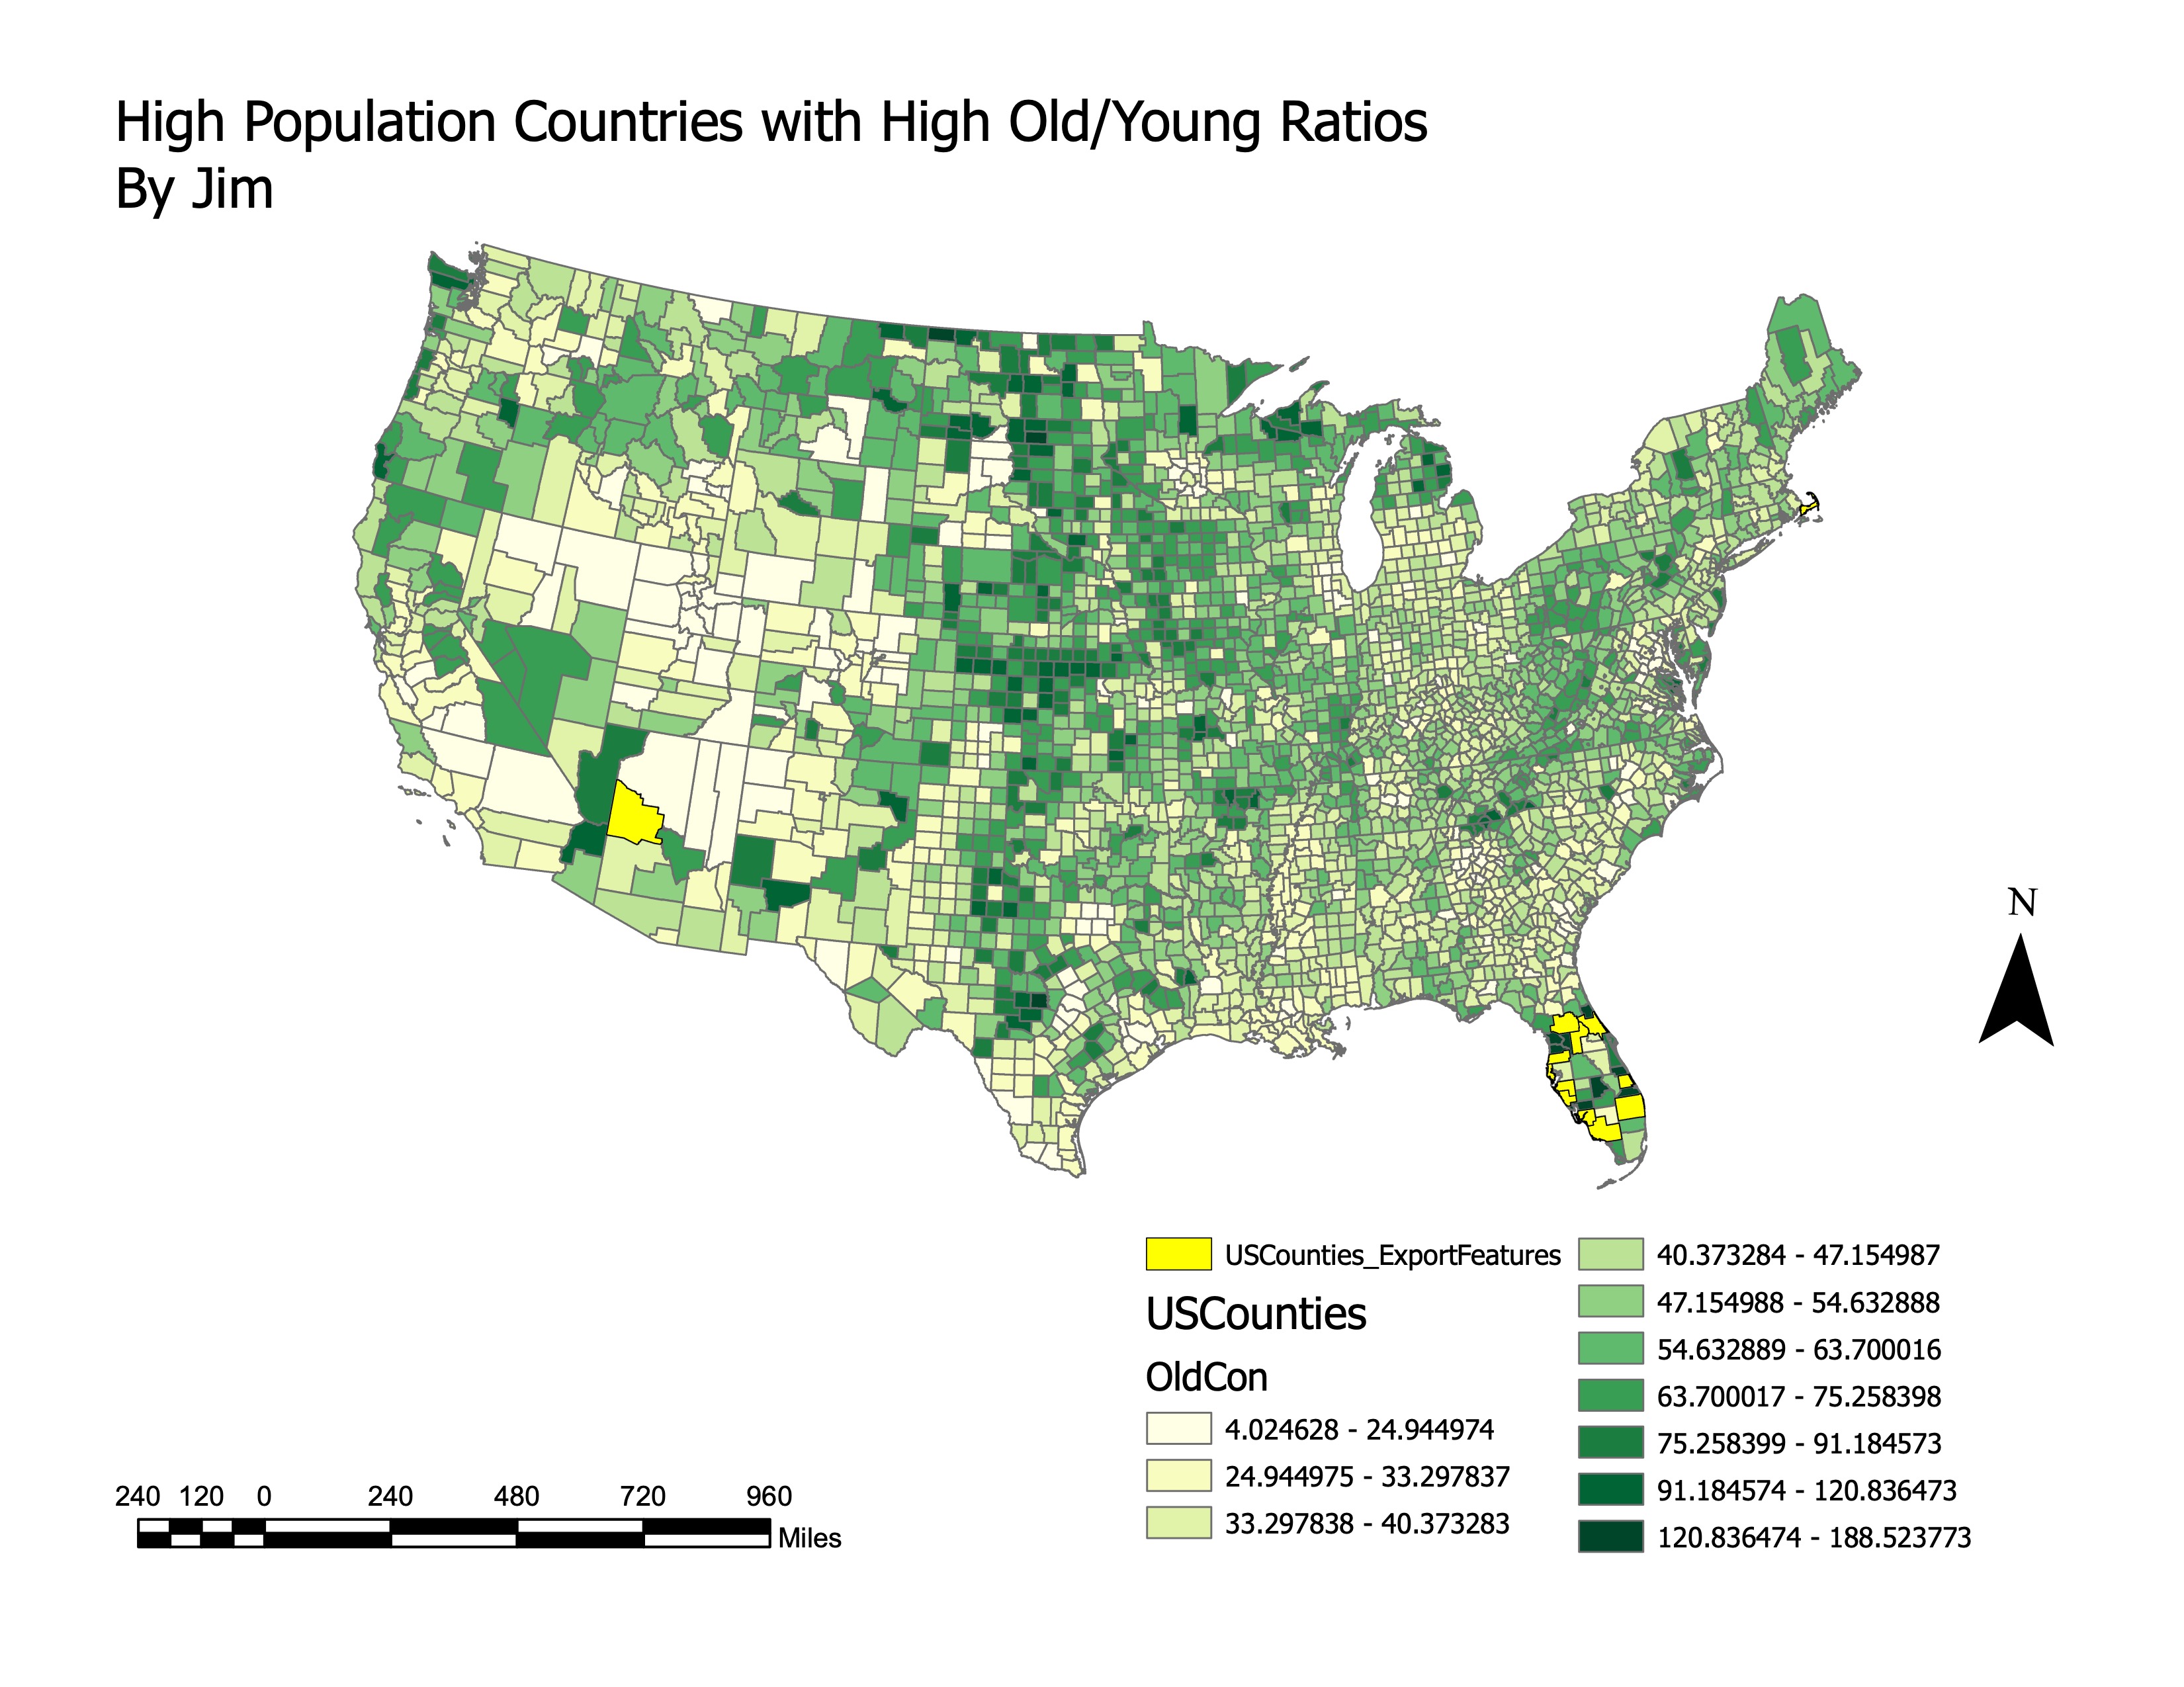
4.1 High Population Counties with High Old/Young Ratios
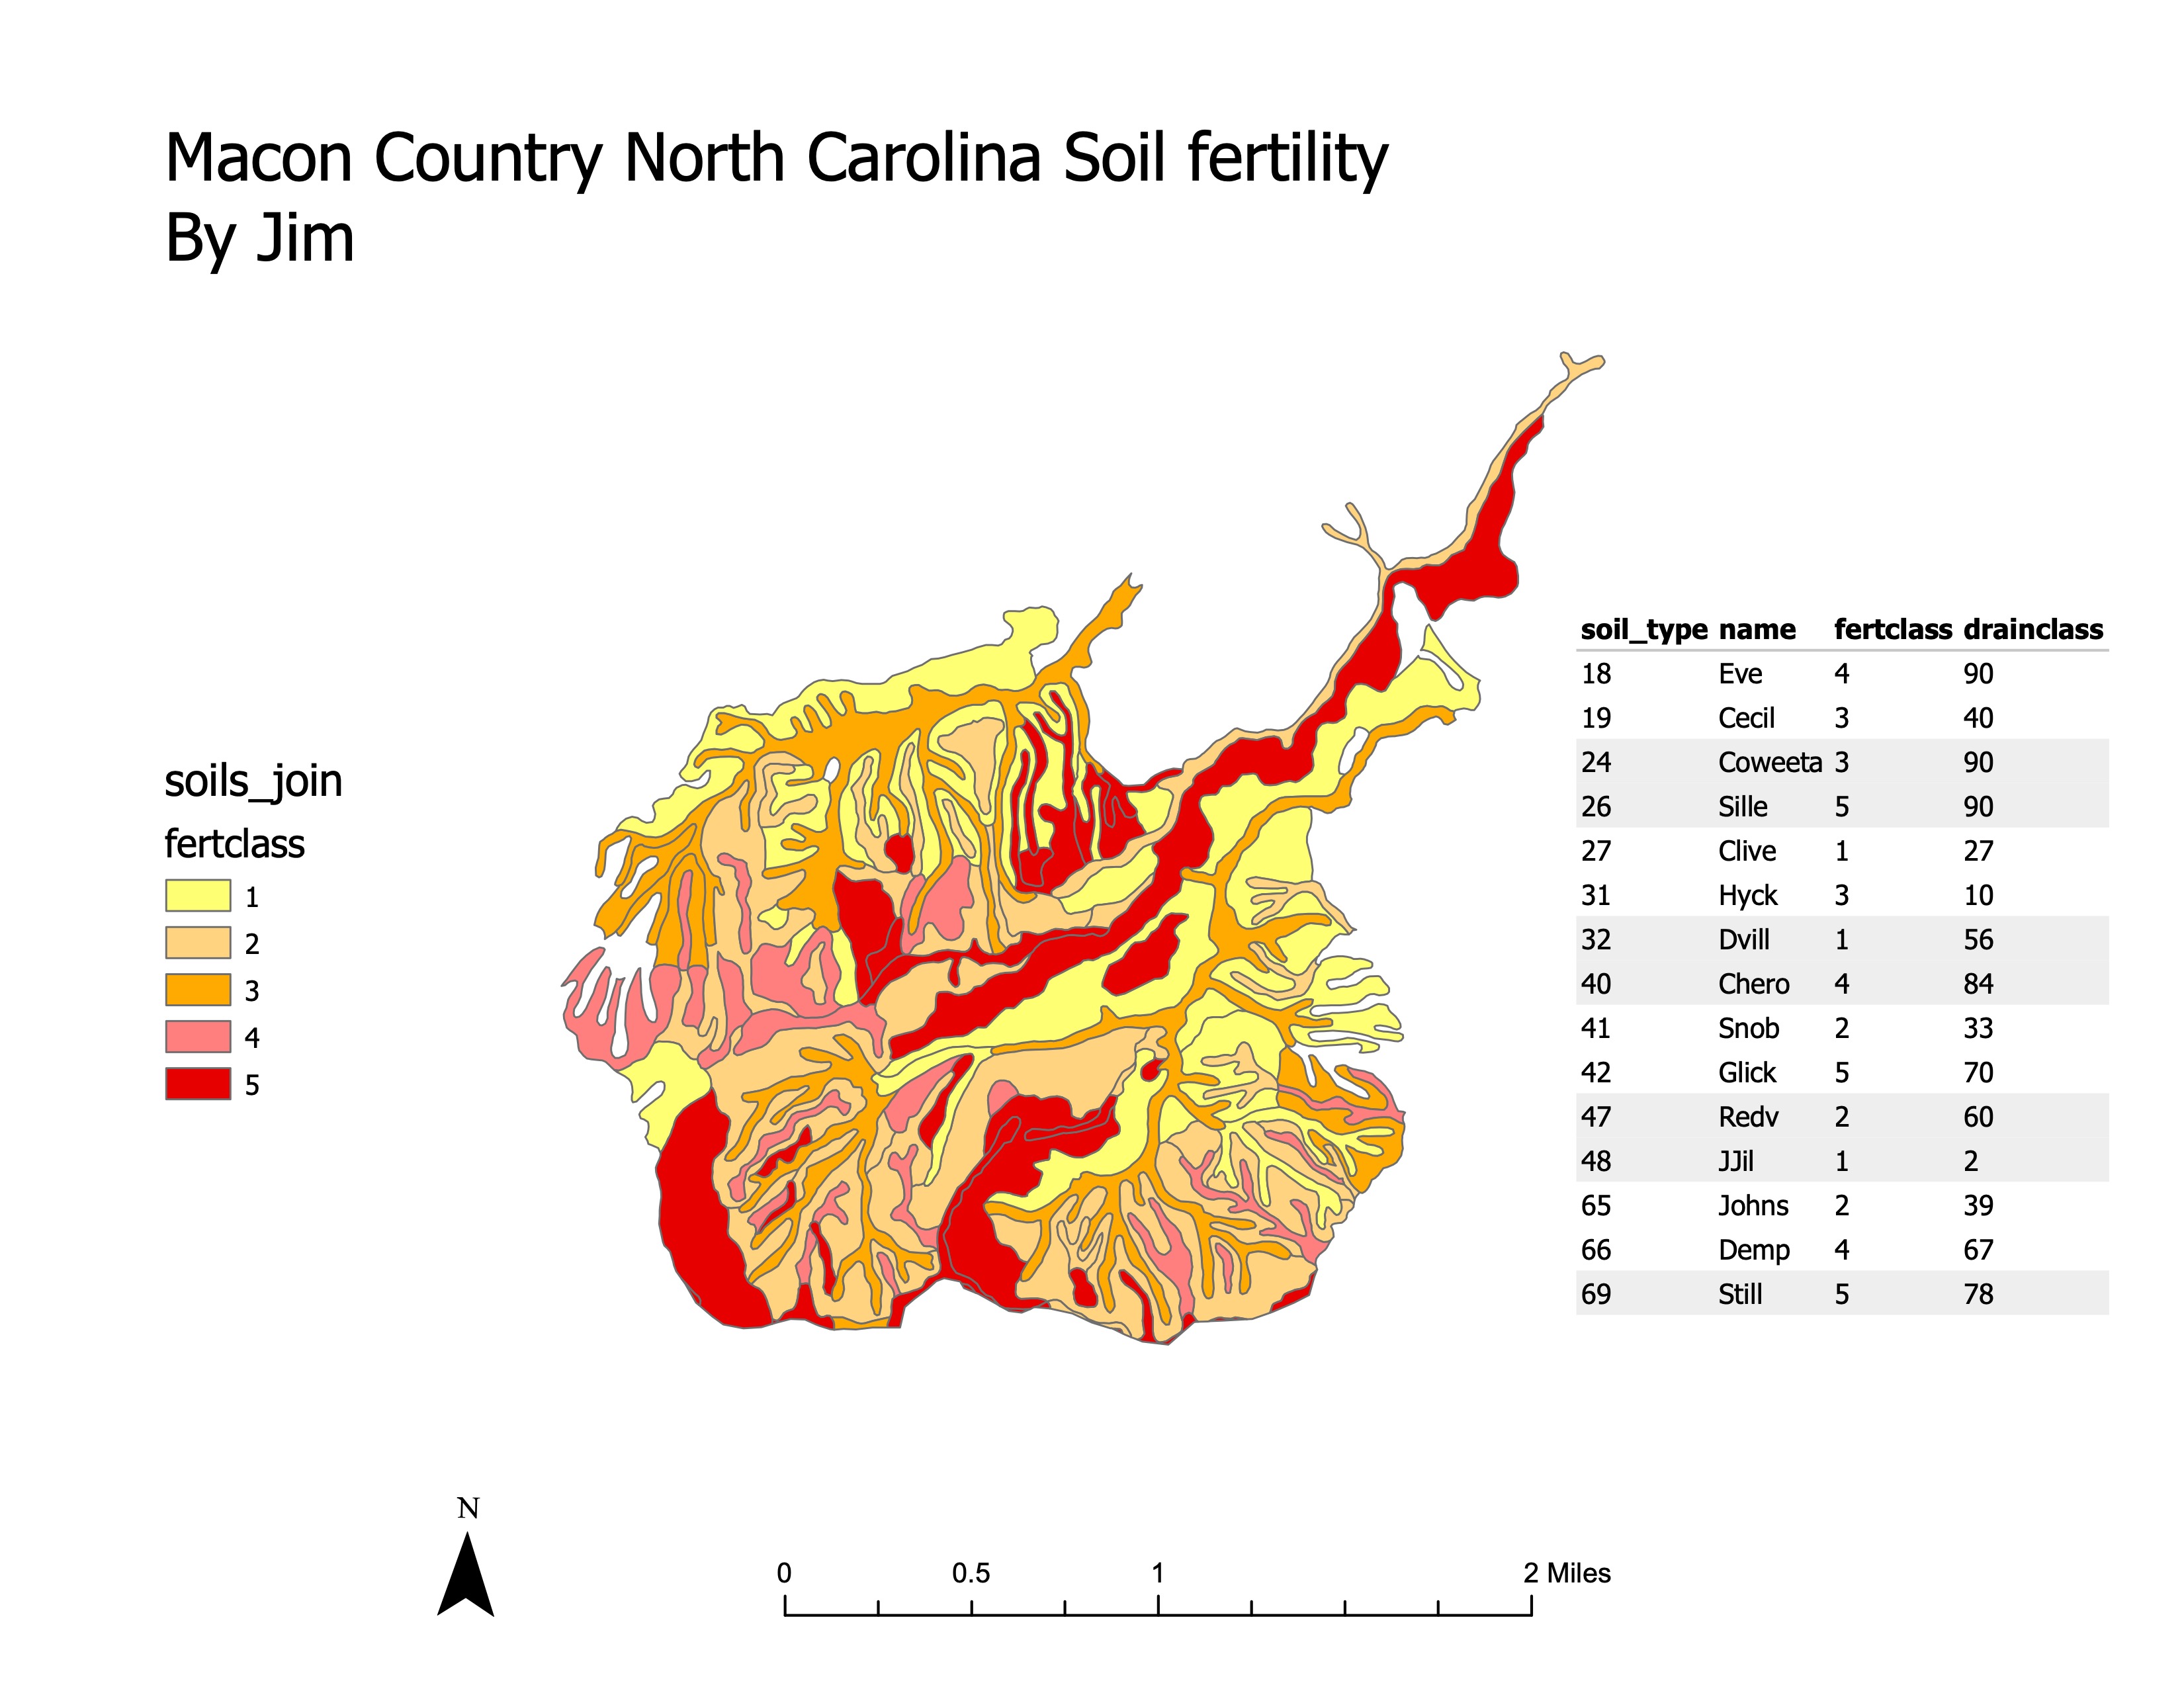
4.2 Macon Country North Carolina Soil Fertility
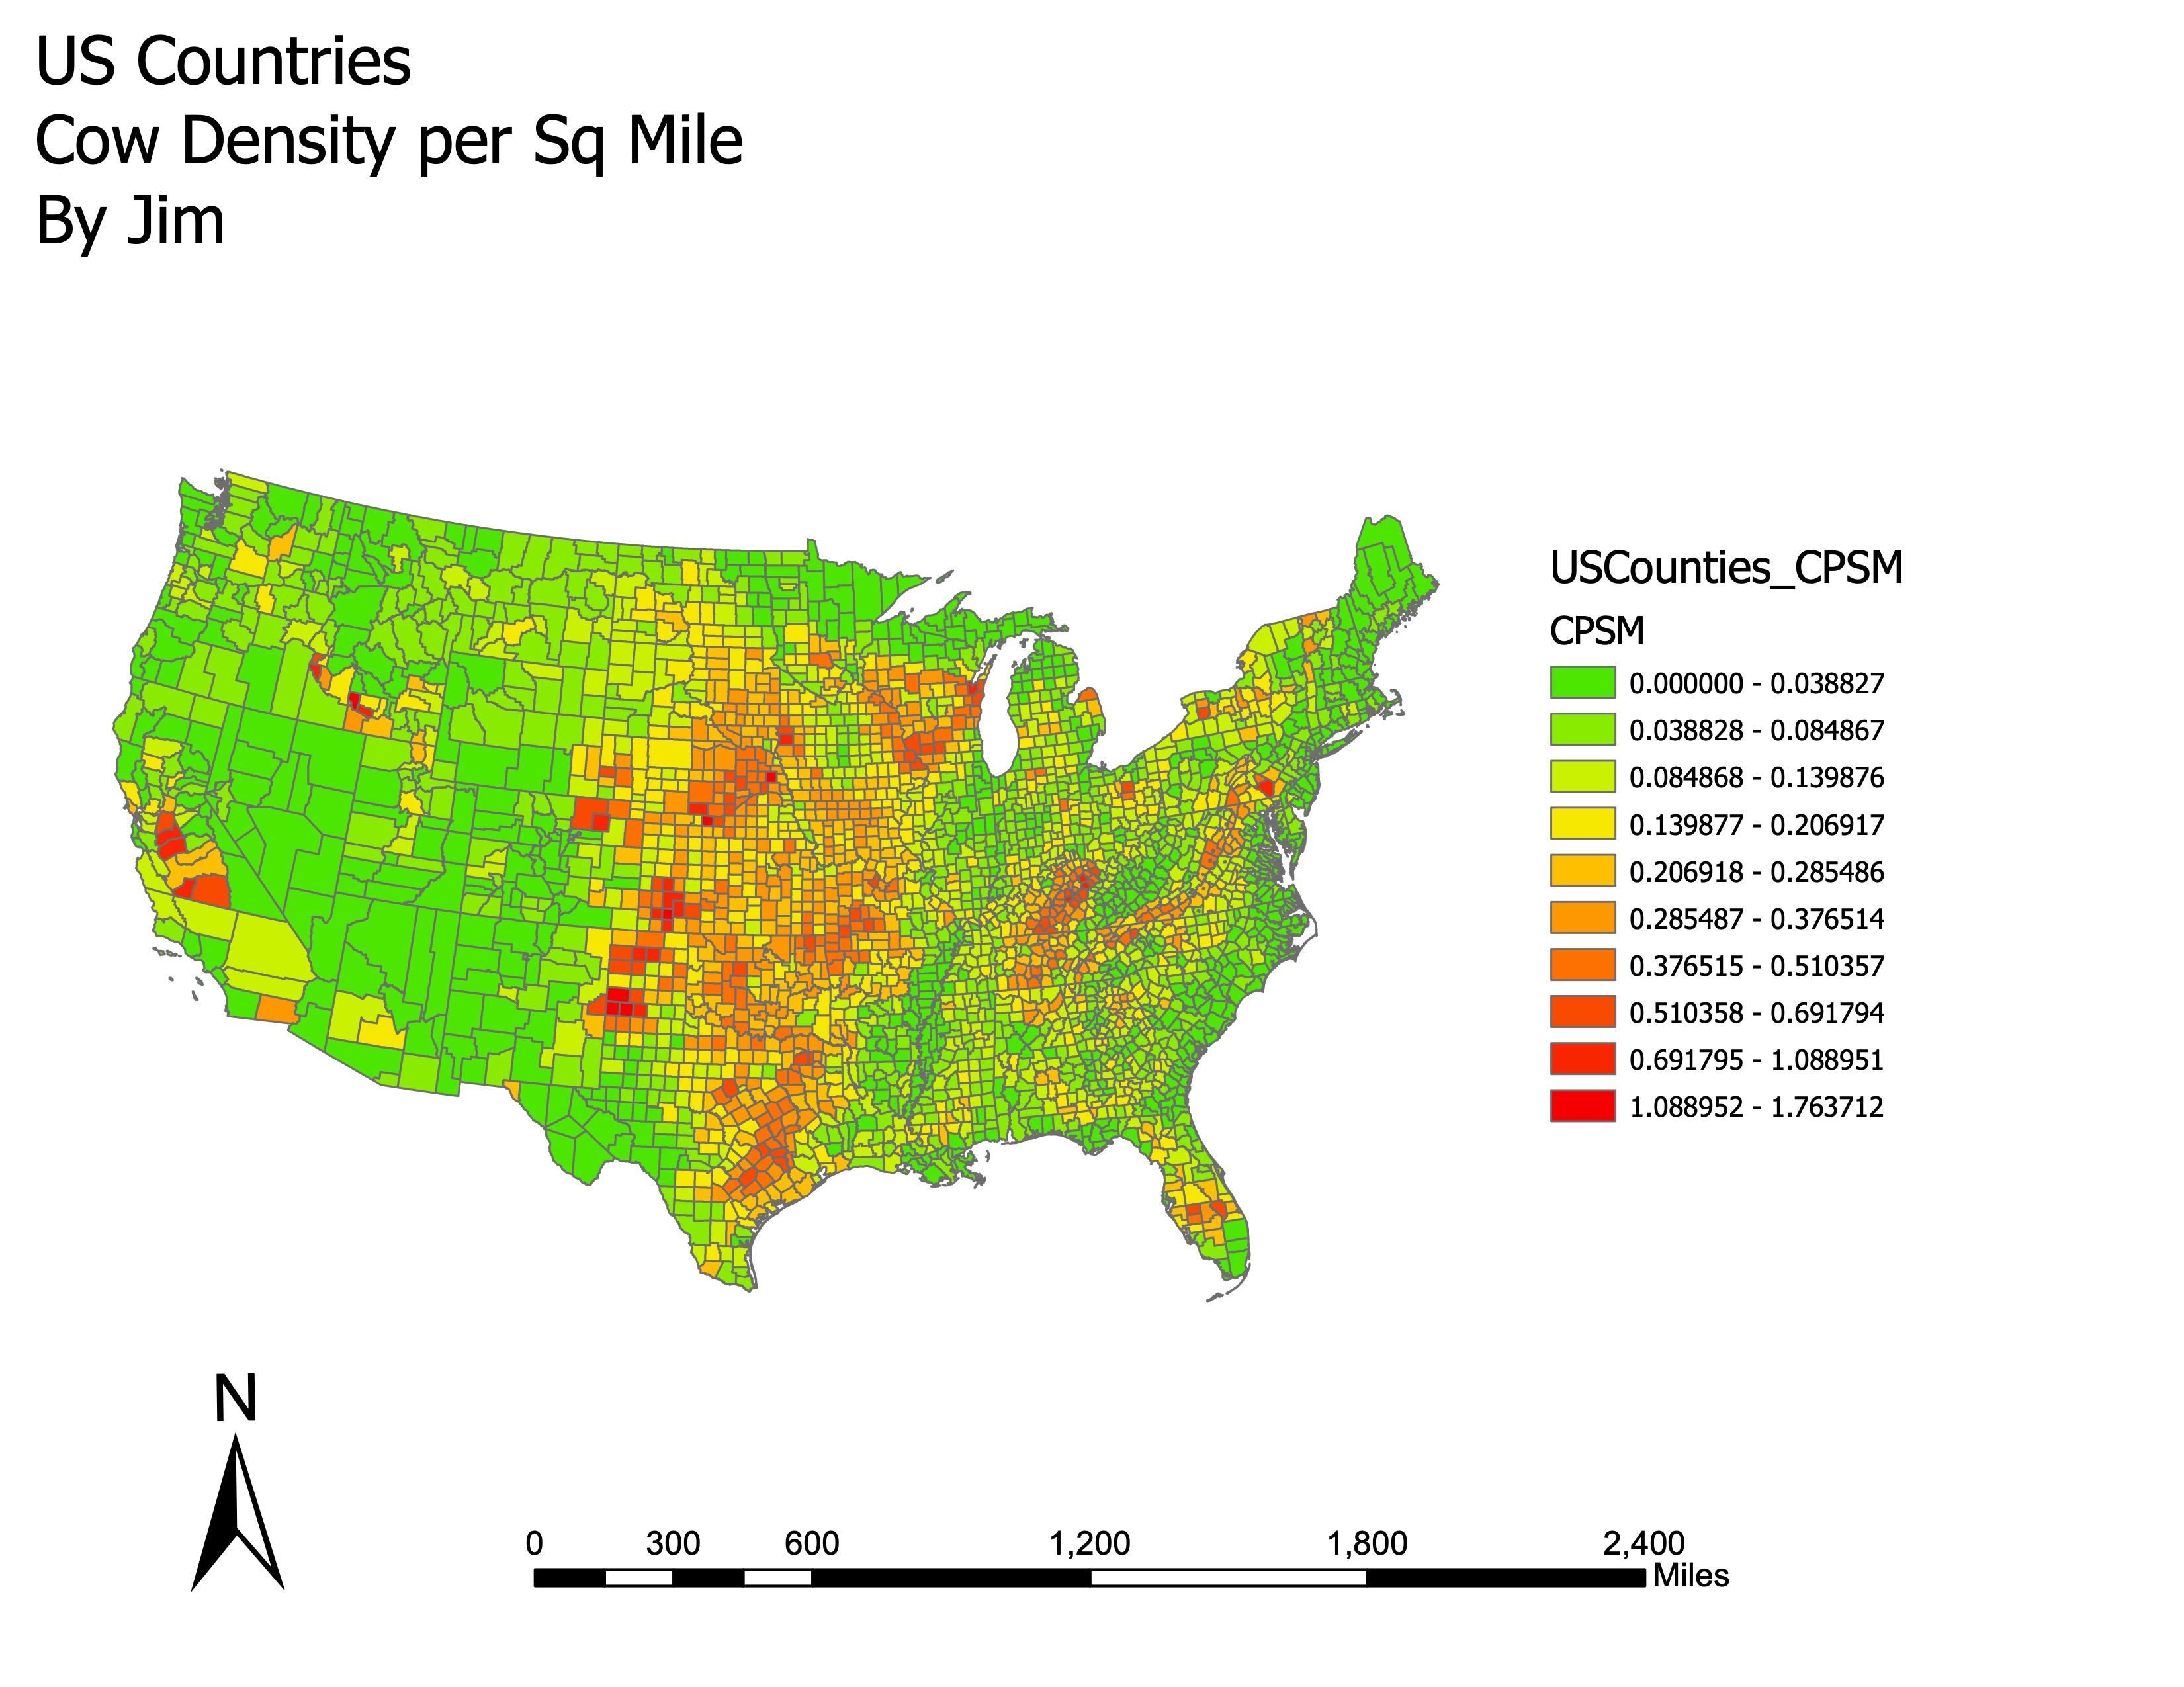
4.3 US Counties Cow Density per Square Mile
5 Conclusion
This lab provided hands-on experience with selecting attributes, managing tables, and joining data in ArcGIS. The ability to manipulate and display tabular data is crucial for effective GIS analysis.